
Student Achievement
Student Achievement Data
Dallas Baptist University (DBU) is committed to student learning and success as part of its mission to “provide Christ-centered quality higher education.” The University’s 2025-2029 Strategic Plan A Better Way outlines a number of strategic initiatives designed to “Elevate Transformative Education.” The Office of Institutional Effectiveness and Research strives to support and document the continuous improvement efforts of all DBU academic units as part of DBU’s ongoing Kingdom work.
As part of the process of continuous improvement, DBU tracks and reports its performance regarding student retention, graduation rates, and other measures of student success. For graduation rates DBU has identified the 6-Year National Student Clearinghouse Total Completion Rate as its Key Student Completion Indicator and reports student completion rates at six years after matriculation. DBU also tracks the success of its students in achieving professional certifications and assesses General Education and Academic Program Learner Centered Outcomes on a regular basis.
For each of the measures published here, a threshold of minimum acceptability is identified along with a justification, a goal for achievement is identified, and a brief narrative discusses DBU’s evaluation of success in the identified area.
Retention Rates
Minimum Threshold of Acceptability: DBU has established a 65% first-to-second year retention rate as its minimum threshold of acceptability. This threshold is based upon its recent historic performance in this area as well as analysis of market data and other trends.
The Goal for Achievement
DBU has established a goal to achieve 70% first-to-second year retention by the Fall of 2027 and to achieve 73% first-to second-year retention by the Fall of 2029. These goals are derived from the Strategic Plan and recent trends in this area.
| Fall to Fall | Original Cohort | Adjusted Cohort | Retained | Retention Rate |
|---|---|---|---|---|
| Fall 2018 to Fall 2019 | 535 | 532 | 381 | 71.62% |
| Fall 2019 to Fall 2020 | 571 | 565 | 427 | 75.58% |
| Fall 2020 to Fall 2021 | 607 | 601 | 410 | 68.22% |
| Fall 2021 to Fall 2022 | 679 | 679 | 422 | 62.15% |
| Fall 2022 to Fall 2023 | 679 | 679 | 433 | 63.77% |
| Fall 2023 to Fall 2024 | 584 | 584 | 375 | 64.21% |
| Fall 2024 to Fall 2025 | 591 | 591 | 414 | 70.05% |
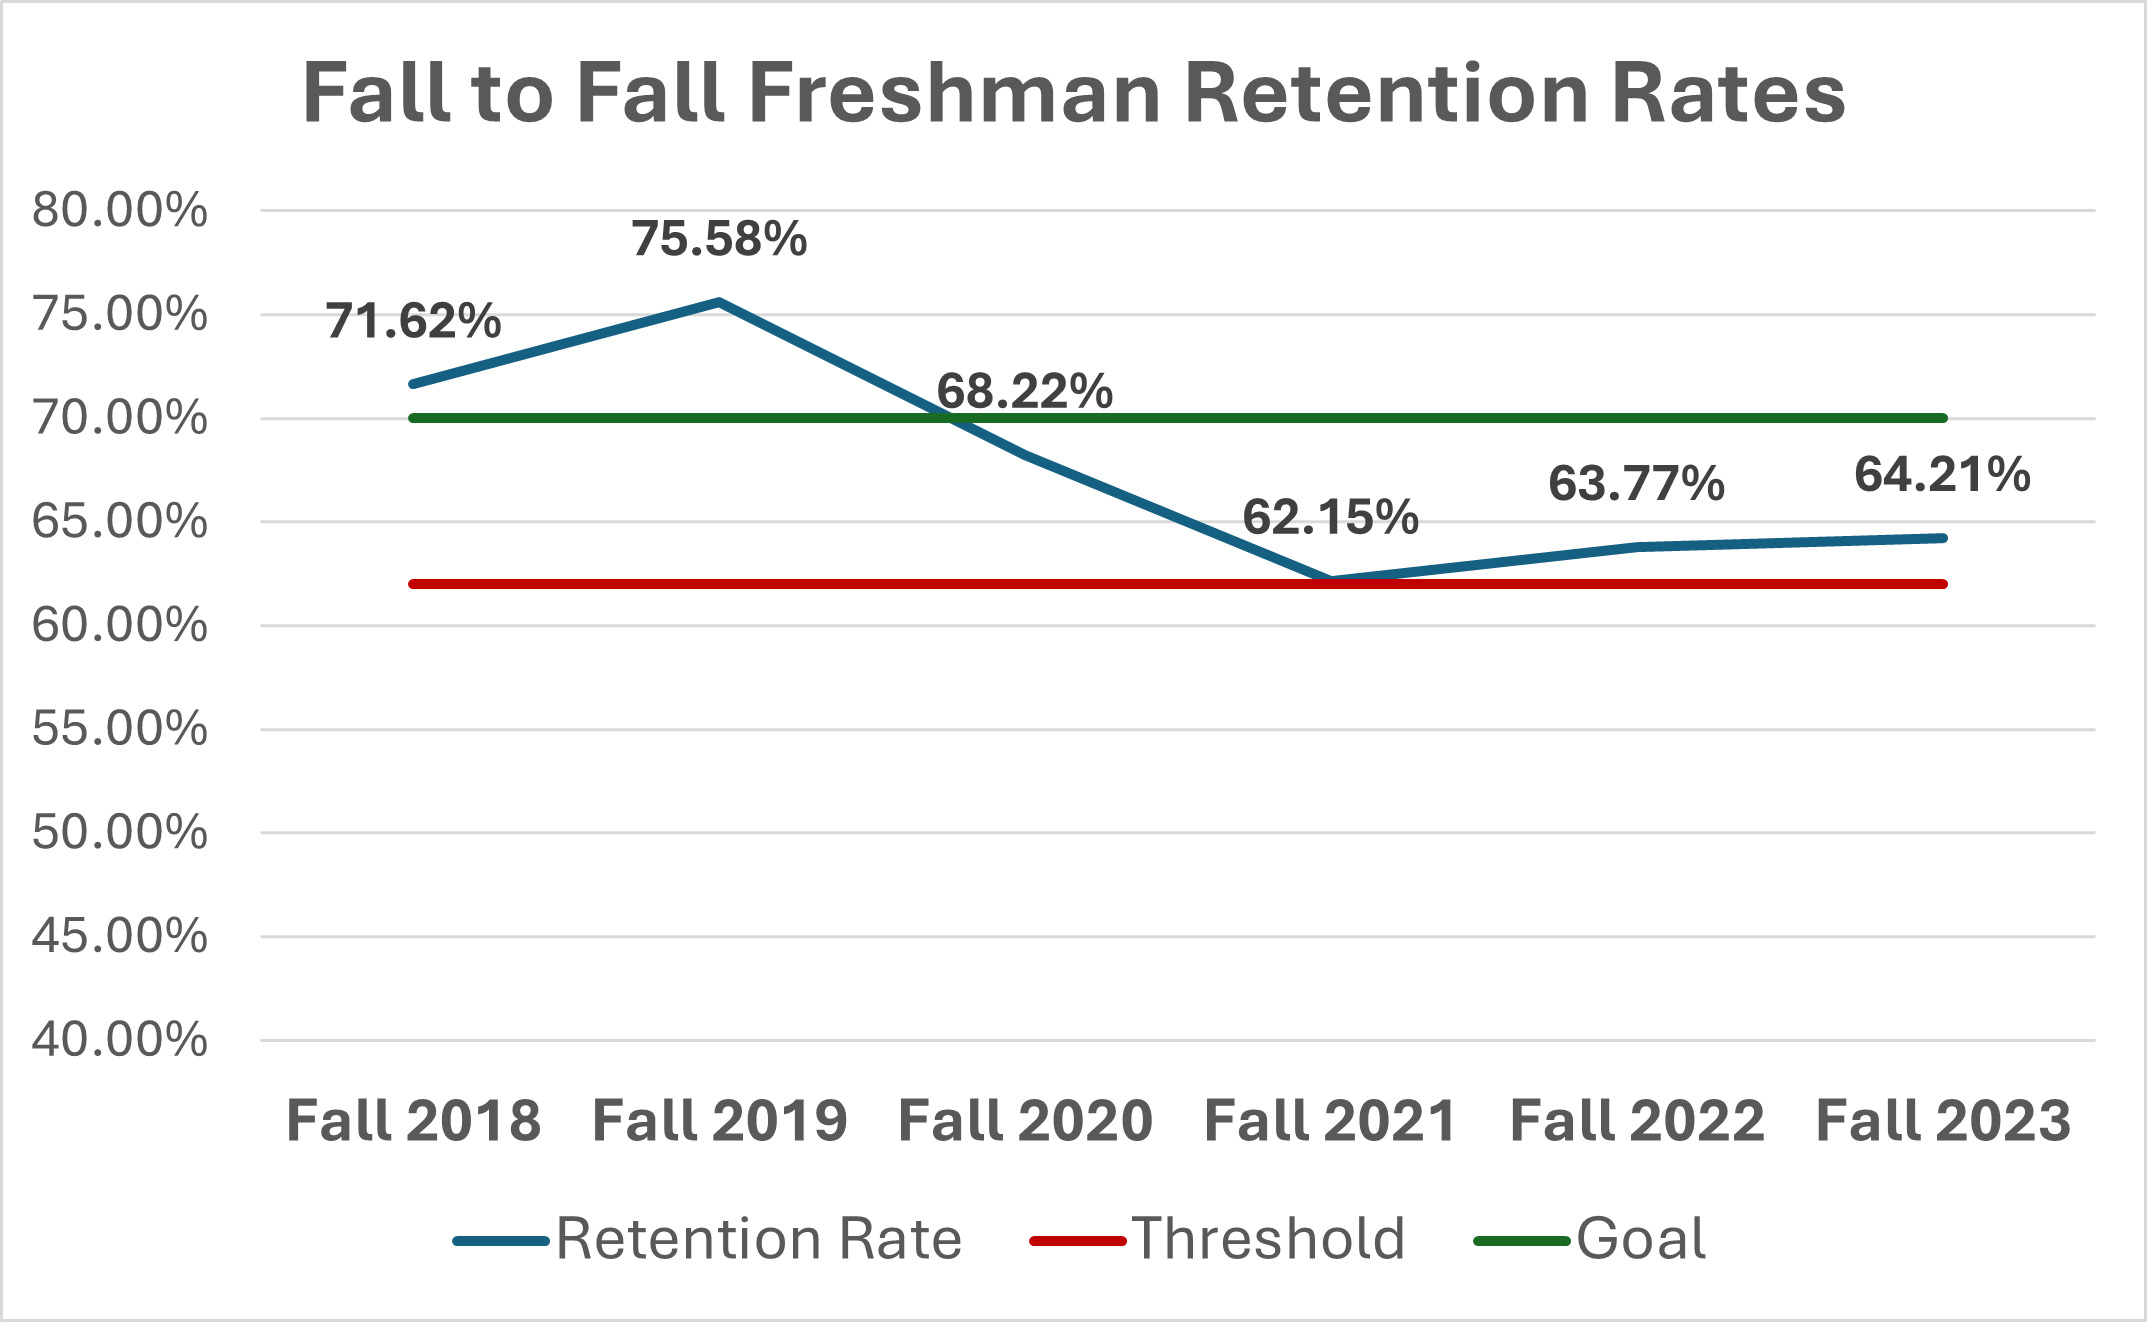
Narrative: Fall-to-Fall retention measurements starting with Fall 2018-Fall 2019 show that the University hit its lowest retention rate in Fall 2021-Fall 2022. Measures taken by the University to improve this rate, such as the implementation of improved software for identifying students in need of support, have led to a steady increase in retention over the past two cycles. Additional efforts to improve retention are ongoing, and the University expects to see the upward trend continue over the next five years.
Overall Graduation Rates
Minimum Threshold of Acceptability: DBU has established a minimum threshold of acceptability for its overall graduation rate of 53% of each cohort graduating within six years of matriculation. This threshold is based upon a historic average transfer-out rate of 33% as well as its recent historic performance in this area.
The Goal for Achievement
DBU has established a goal of 60% of each cohort graduating within six years of matriculation by Fall of 2027 and a goal of 62% graduating within six years of matriculation by Fall of 2029. These goals are derived from the Strategic Plan and recent trends in this area.
6-Year (150%) graduate Rates for Full-Time, First Time Freshman Cohorts
| Year | Original Cohort | Adjusted Cohort | Transfer red Out | Persisted | Graduated 6 years | GR Rate 150% |
|---|---|---|---|---|---|---|
| Fall 2011 | 439 | 439 | 154 | 285 | 254 | 57.86% |
| Fall 2012 | 489 | 488 | 165 | 323 | 258 | 52.87% |
| Fall 2013 | 489 | 485 | 146 | 339 | 282 | 58.14% |
| Fall 2014 | 492 | 492 | 157 | 335 | 274 | 55.69% |
| Fall 2015 | 496 | 494 | 134 | 360 | 303 | 61.34% |
| Fall 2016 | 522 | 521 | 179 | 342 | 295 | 56.62% |
| Fall 2017 | 538 | 538 | 142 | 396 | 325 | 60.41% |
| Fall 2018 | 535 | 535 | 160 | 375 | 305 | 57.01% |
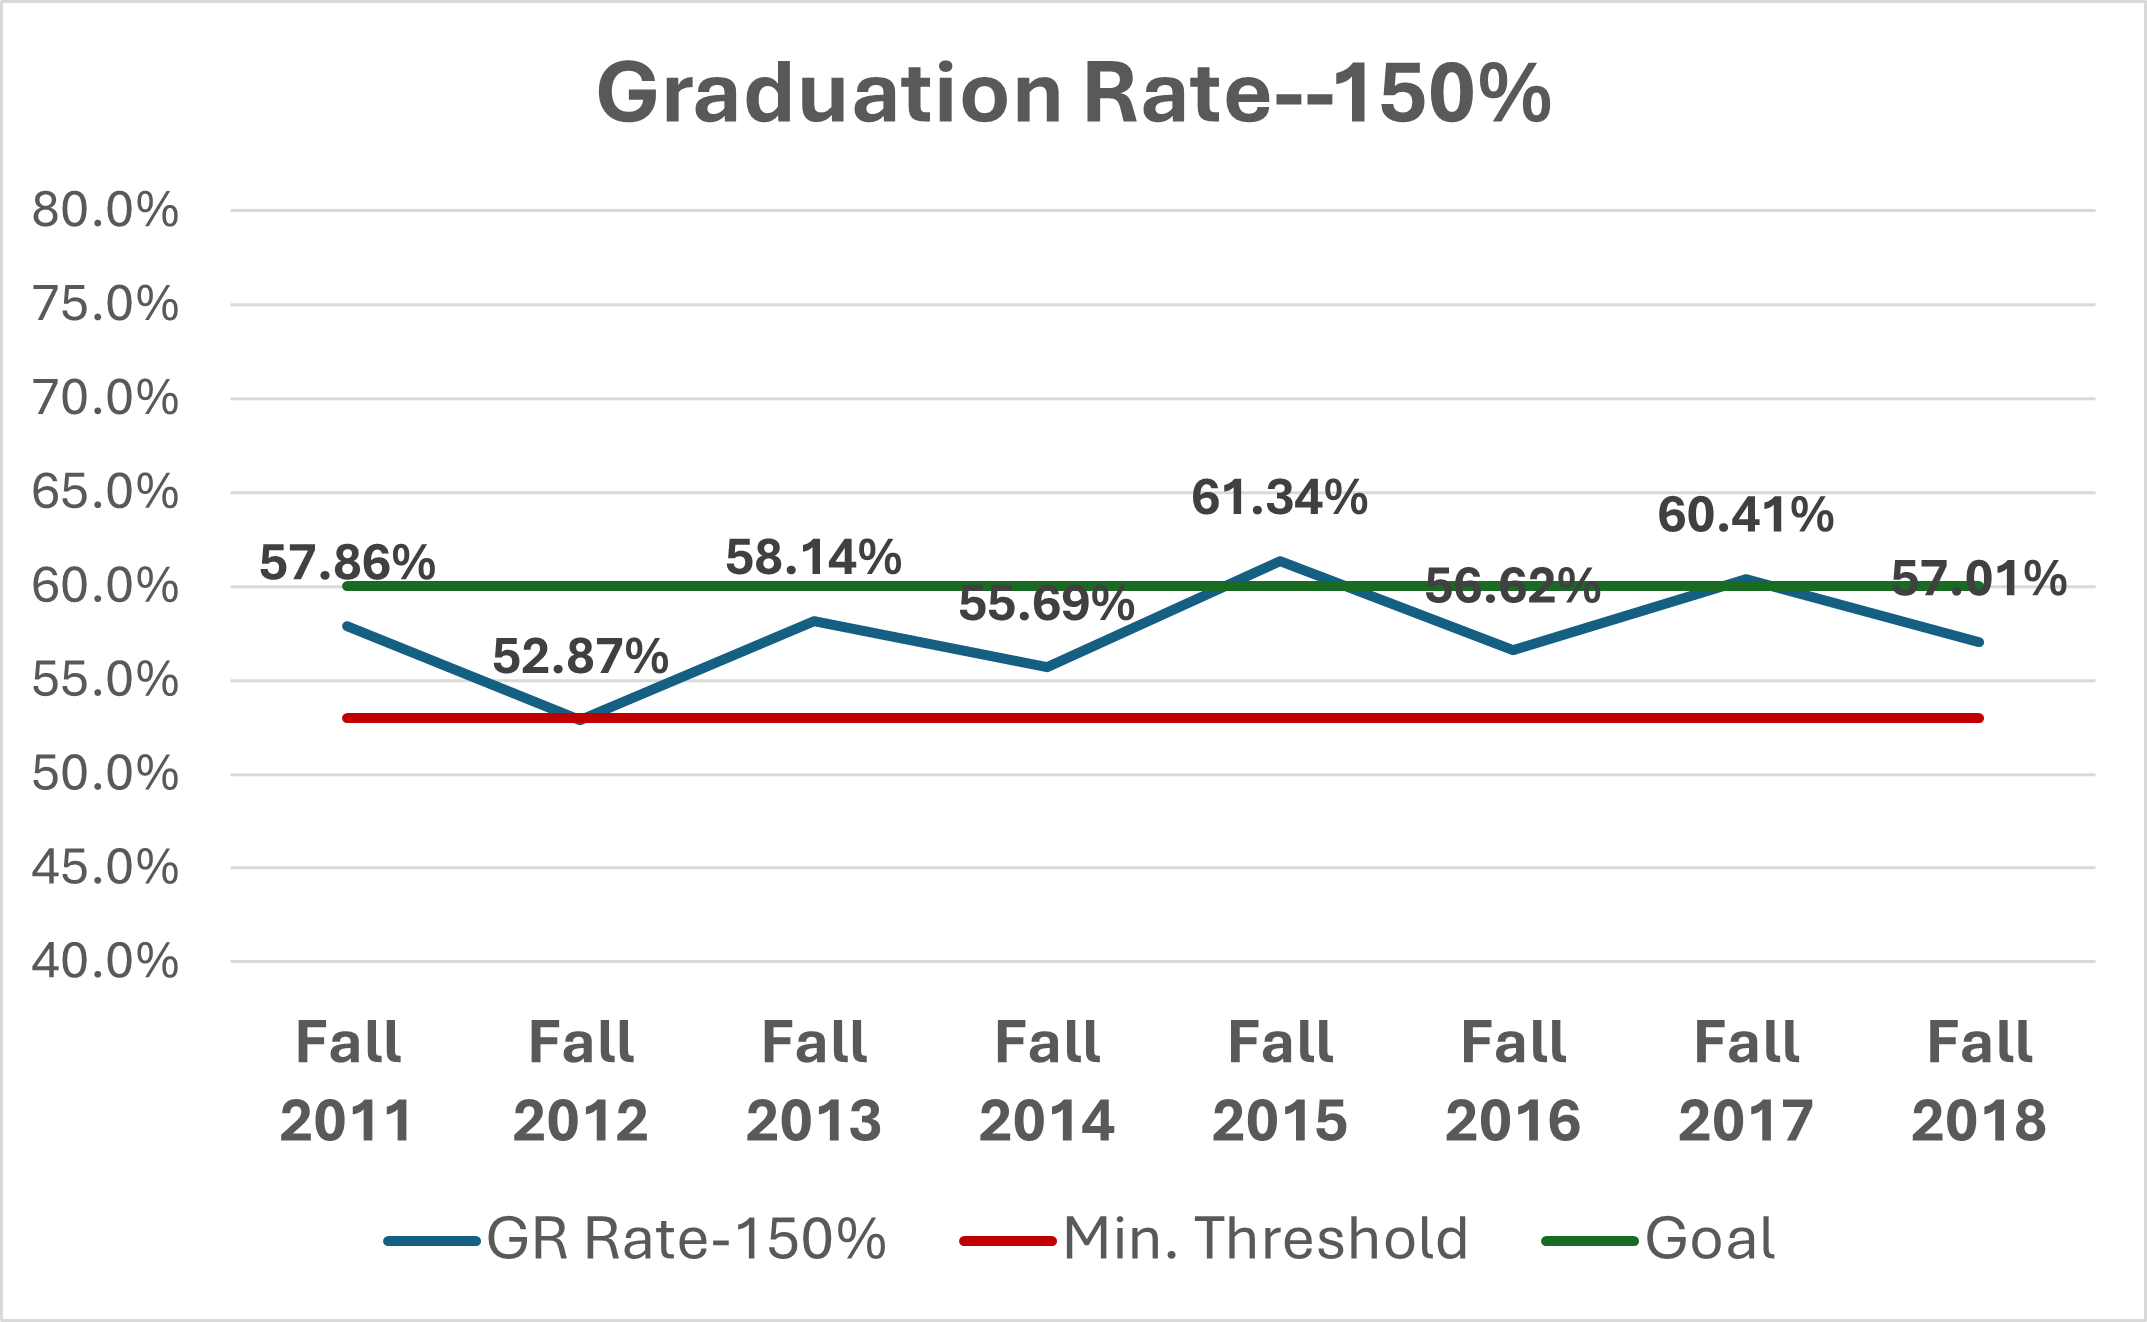
Narrative: DBU has an average six-year graduation rate of 57.5% from cohorts beginning in 2011 to cohorts beginning in 2018. For each individual student, the time to graduation is impacted by a variety of factors including degree plan, number of hours attempted per semester, finances, employment, and other circumstances. Retention rates and graduation rates are connected, and as retention and persistence improve, then graduation rates should also see positive improvement. Therefore, the initiatives to improve retention and persistence are also key measures to improve graduation rates.
Graduate Employment Rates
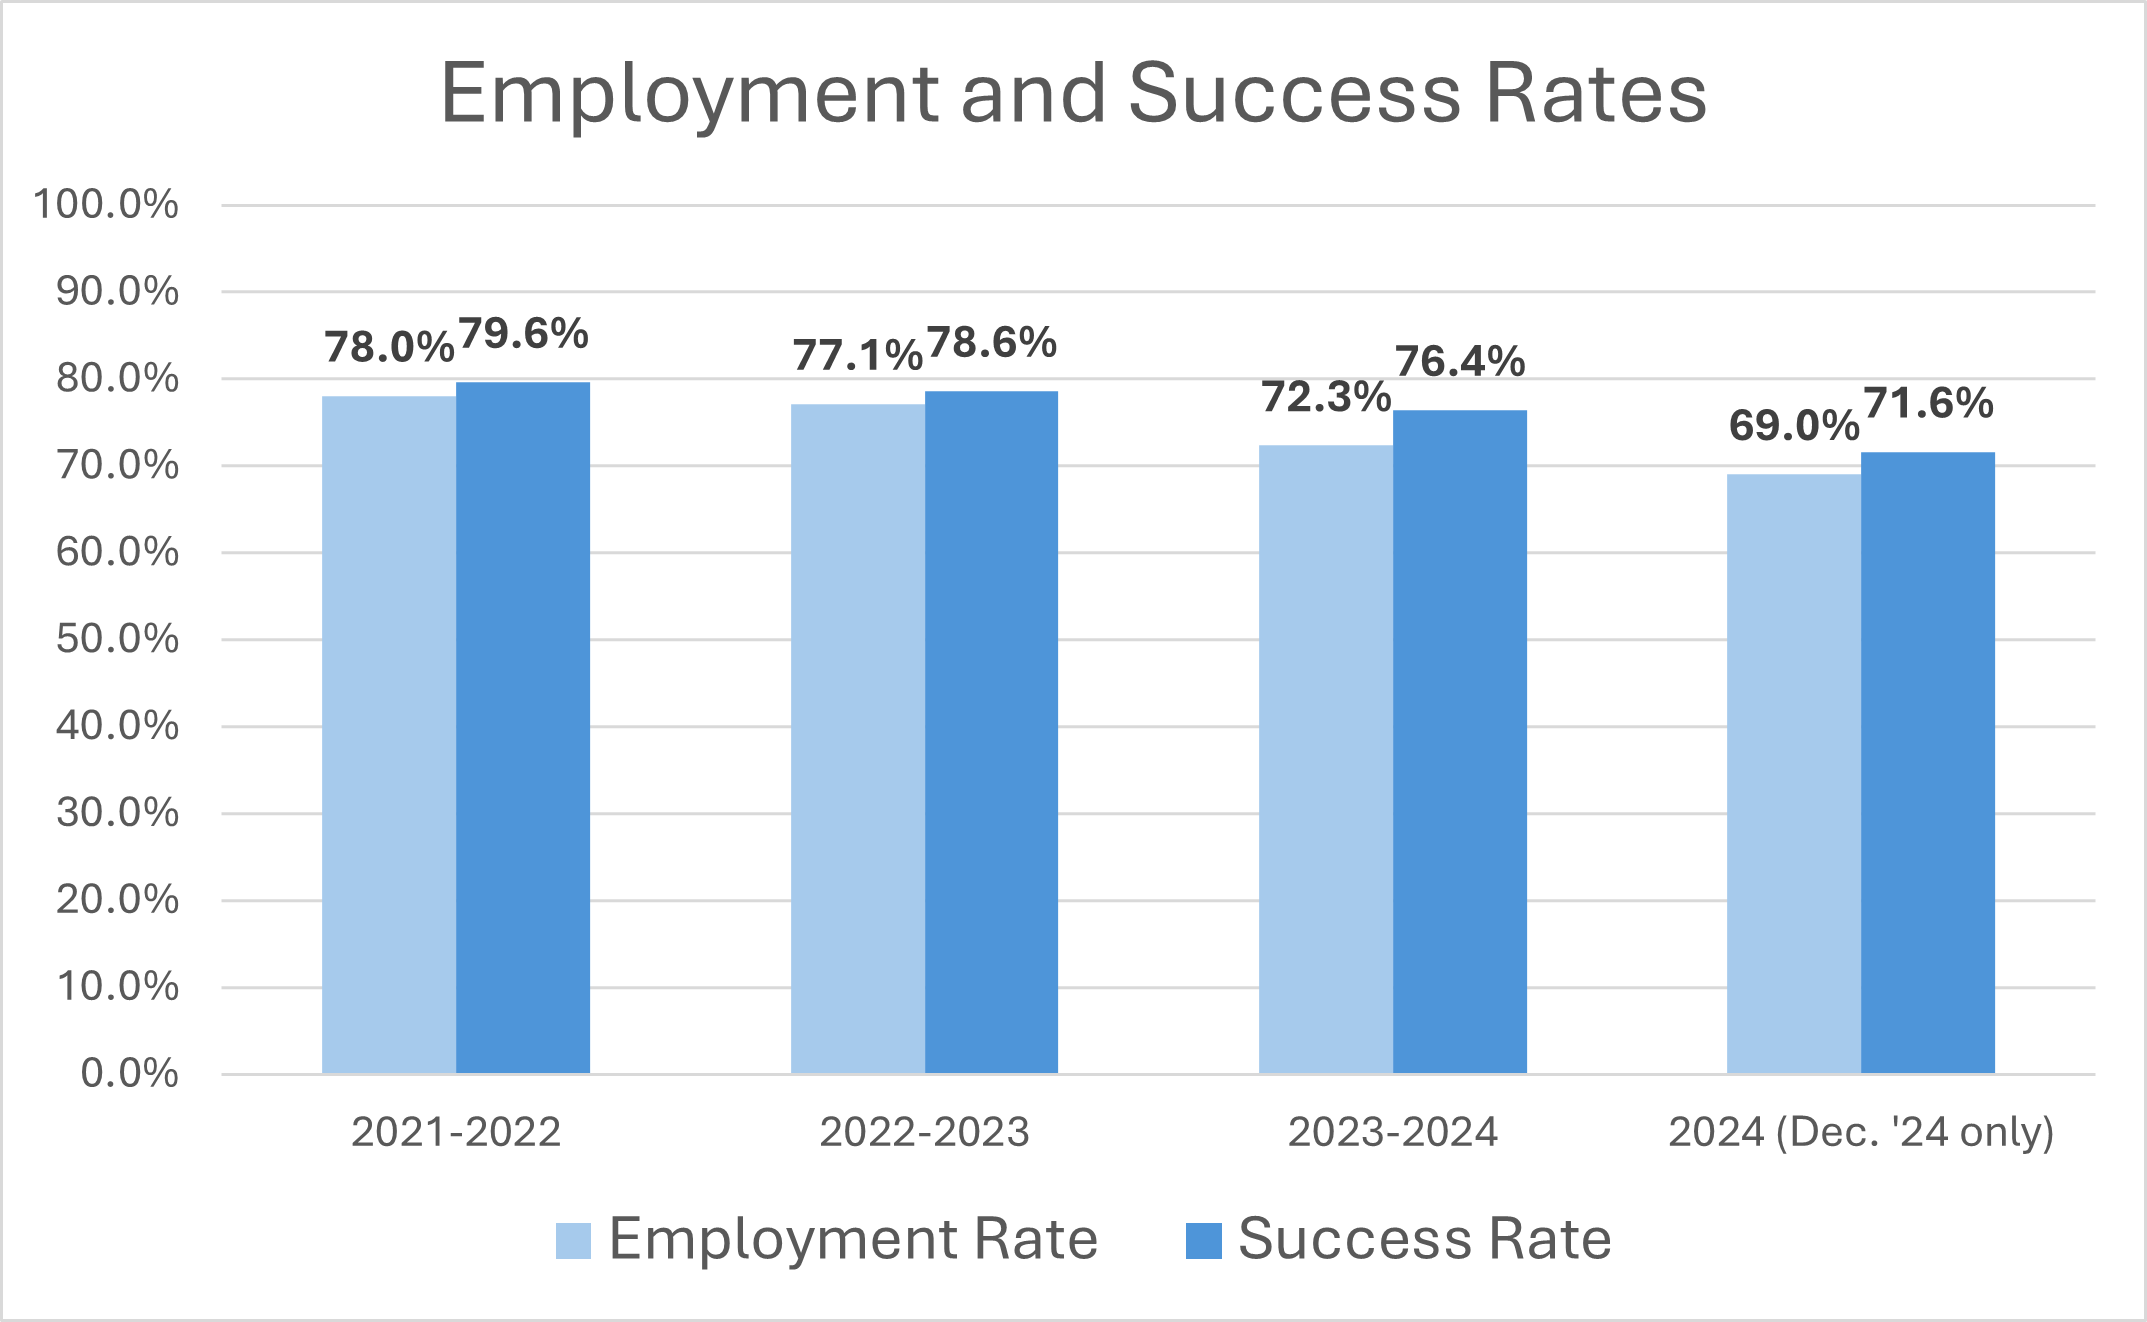
Minimum Threshold of Accountability: DBU has established a 60% overall employment and rate upon graduation as its minimum threshold of acceptability. This threshold is based upon employment rate yearly averages since 2016.
The Goal for Achievement
DBU has established a goal of 75% employment and success rate to be achieved by the academic year 2028-2029. This goal is derived from recent performance and the 2025-2029 Strategic Plan Pillar 3, Initiative 1: “Bolster career development opportunities for students and alumni through a mix of initiatives, which include improving career preparation, expanding internship placements, networking with prominent organizations, and providing access to Christ-centered lifelong educational experiences.” The charts below show the cohort sizes and employment and success rates for all DBU Graduates.
| Cohort Academic Year | Total Graduates |
|---|---|
| 2021-2022 | 982 |
| 2022-2023 | 900 |
| 2023-2024 | 959 |
| 2024-2025 | 996 |
*Employment Rates—(# students reporting employment) / (# students reporting employment + #
students reporting they are seeking employment)
*Success Rates—(# students reporting employment + # students reporting employment within three months + # students reporting acceptance into graduate school) / (# students reporting employment + # students reporting employment within three months + # students reporting acceptance into graduate school + # students reporting they are seeking employment + # students reporting they are seeking acceptance into graduate school)
Data is gathered at each commencement ceremony from those in attendance, and a digital survey
is sent to all graduates not in attendance. In compliance with federal regulations, DBU adjusted
its methodology in 2024 to gather specific information about students’ plans for further education
and their job seeking intentions. To view historical data using the previous methodology, click
here: 2024 Student Achievement Page
Narrative: For students graduating in the 2024-2025 academic year, 72.4% reported employment, and 75.7% reported success. For students graduating in the 2023-2024 academic year, 72.3% reported employment, and 76.4% reported success.
The University continues to expand the Center for Career and Professional Development, including the Career Services, Service-Learning, and Mentoring departments, to assist students in achieving a successful career path.
Educator Licensure
Minimum Threshold of Acceptability: The Texas Education Agency (TEA) has established a minimum threshold of acceptability for all candidates passing licensure tests by the second attempt.
The Goal for Achievement
The Dallas Baptist University Educator Preparation Program (EPP) expects 100% of candidates to pass all licensure tests by the second attempt. This goal applies to undergraduate candidates seeking initial certification and to graduate candidates seeking advanced certification. The following graphs show the percentage passing rates for DBU College of Education students in the EPP.
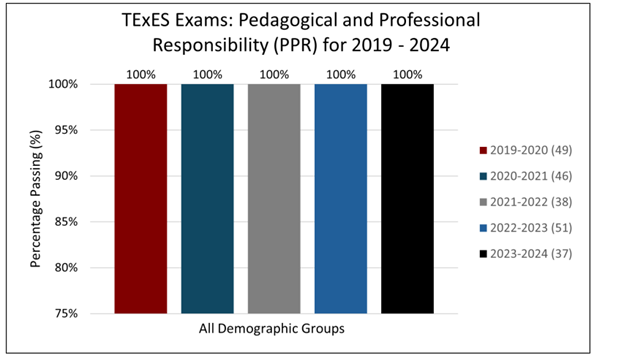
TExES Professional Pedagogy and Responsibilities test is required for all initial certification (classroom teacher) candidates.
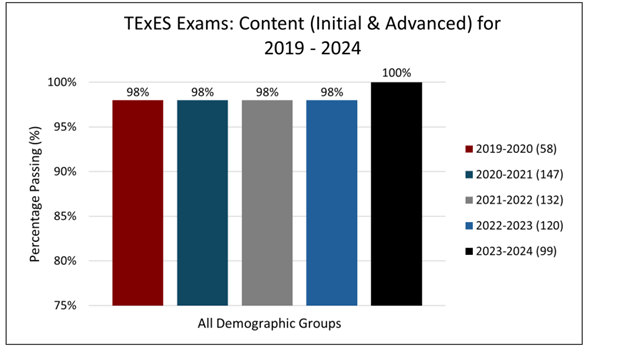
Depending on their area of certification, candidates working toward both initial and/or advanced certifications take a content certification test.
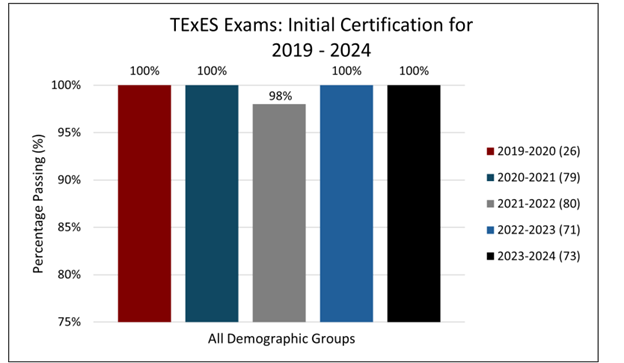
The initial certification tests pertain to teacher candidates only.
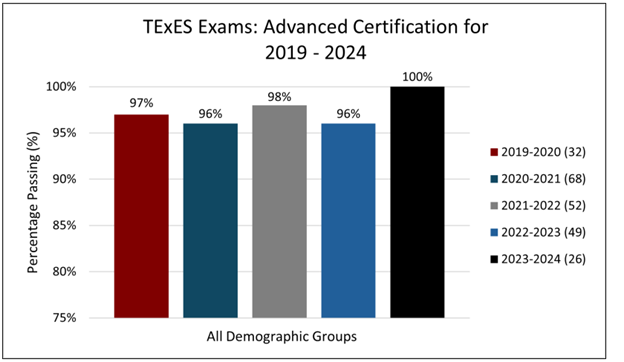
Graduate candidates seeking advanced certifications take various licensure tests including school counselor, principal, superintendent, educational diagnostician, and reading specialist examinations.
Narrative: Since 2019 96%-100% of candidates in the DBU Educator Preparation Program have passed their TExES PPR, Content, and/or Advanced Certificate licensure tests by the second attempt. This information can be found via the following Texas Education Agency pages, for not only DBU, but also all Texas institutions of higher education: PPR Page and Content Page.
College of Christian Faith Graduation and Employment Rates
College of Christian Faith Graduation Rates
Minimum Threshold of Acceptability: The Crowley College of Christian Faith has established a minimum threshold of acceptability for its overall 6-year graduation rate of 40%.
The Goal for Achievement: The Crowley College of Christian Faith has established a goal of
60% for its 6-year graduation rate for the Fall 2022 Cohort.
| Year | Original Cohort | Graduated | GR Rate 150% |
|---|---|---|---|
| Fall 2014 | 77 | 39 | 50.6% |
| Fall 2015 | 81 | 32 | 36.5% |
| Fall 2016 | 70 | 49 | 70.0% |
| Fall 2017 | 81 | 42 | 51.9% |
| Fall 2018 | 60 | 28 | 46.7% |
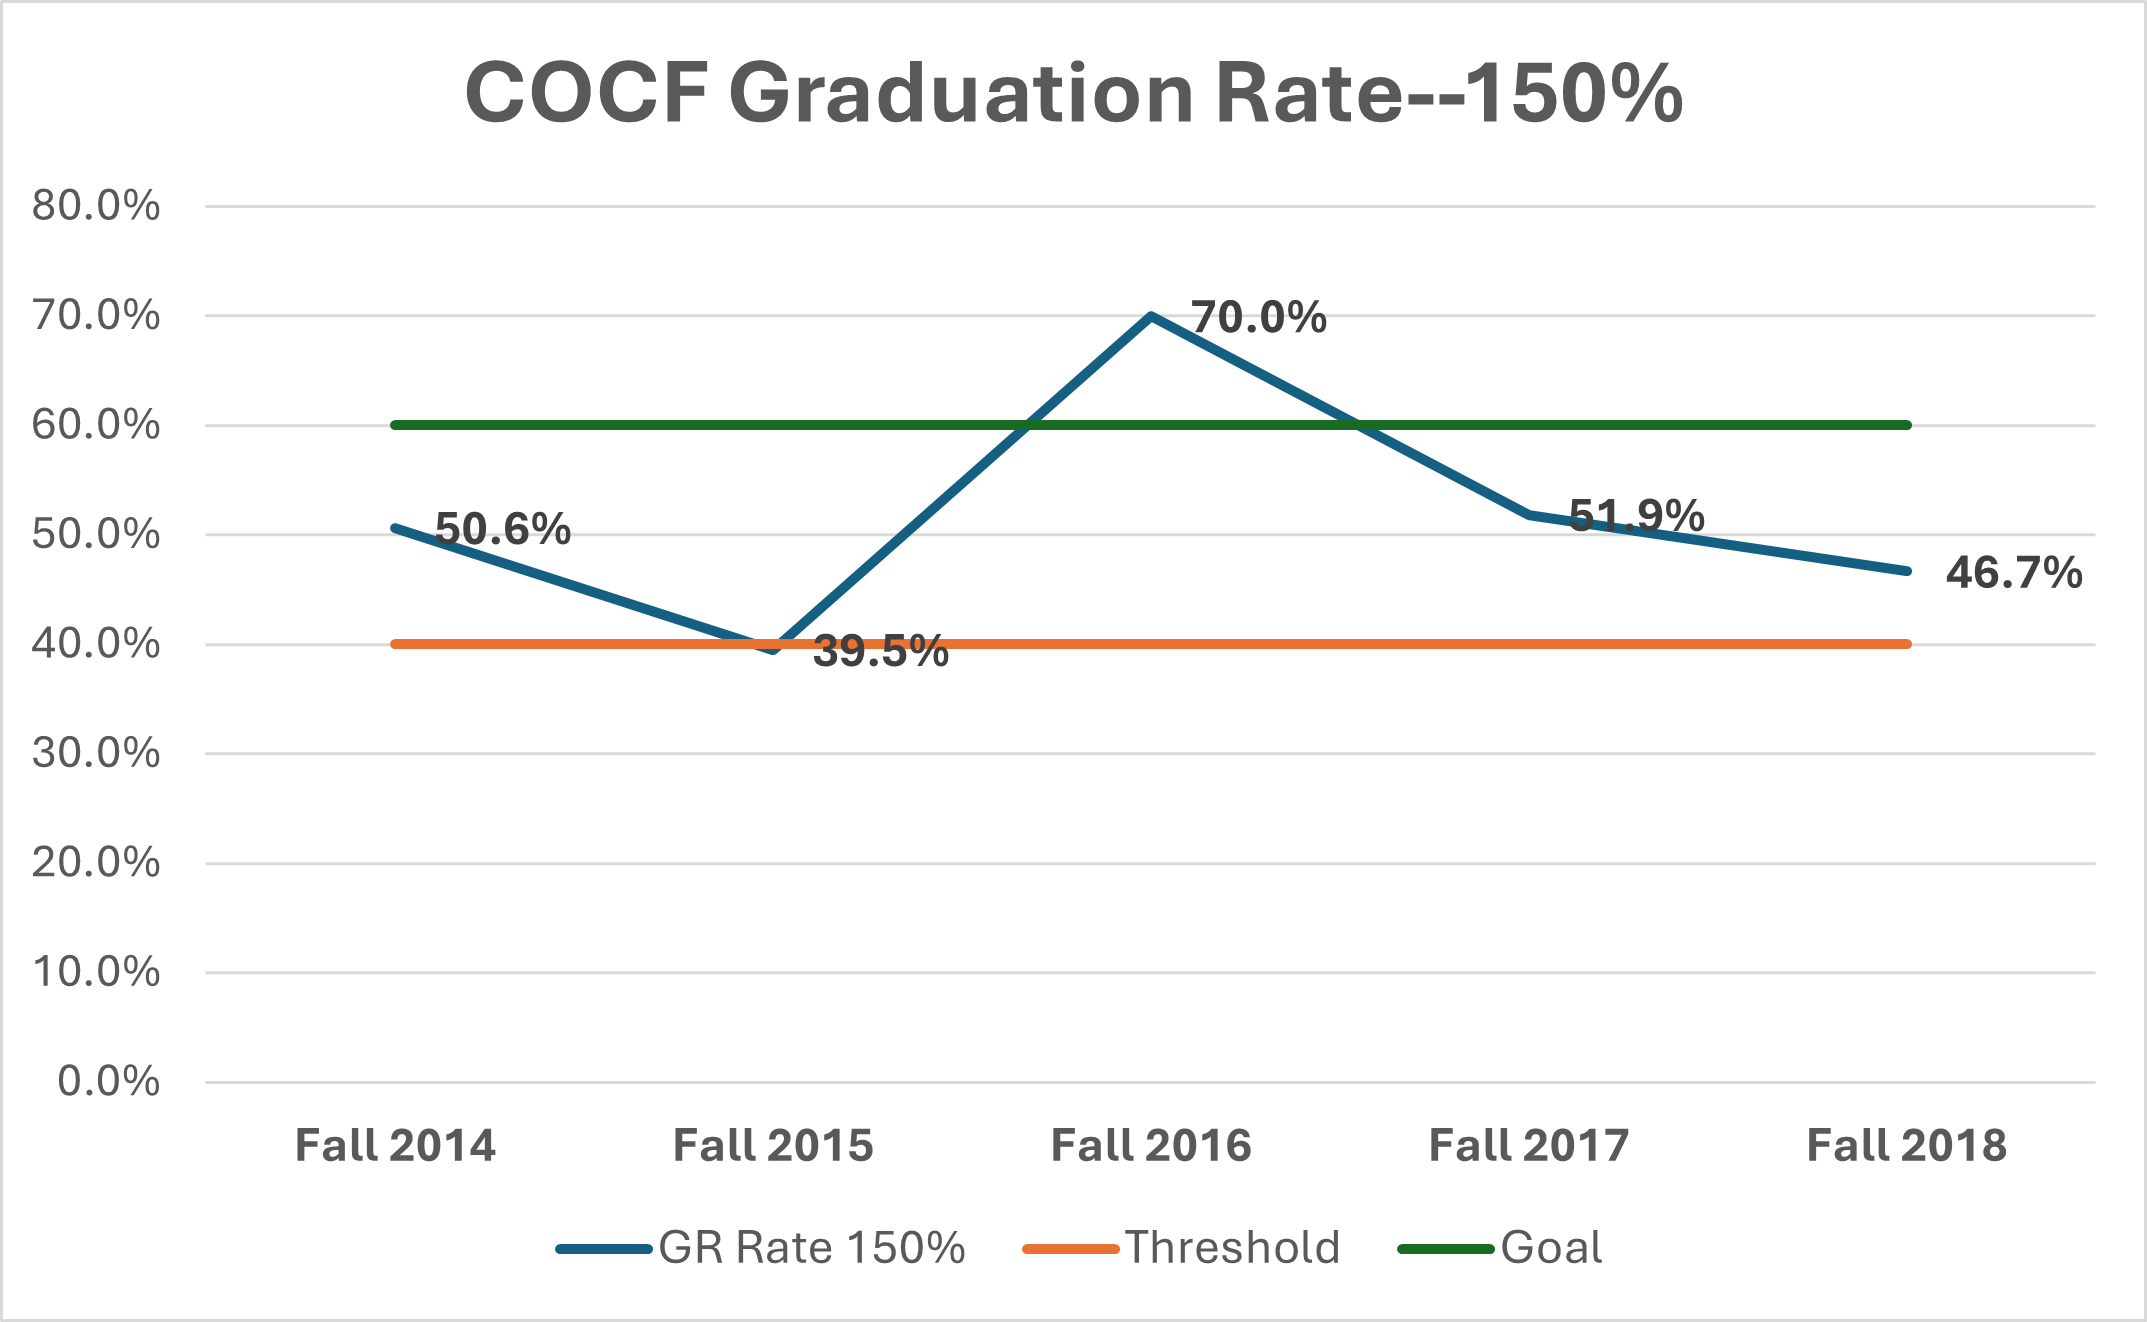
Narrative: The Crowley College of Christian Faith had an average 6-year graduation rate of 51.7% over the five cohorts beginning with Fall 2014. This average exceeds the minimum threshold but does not yet meet the established goal.
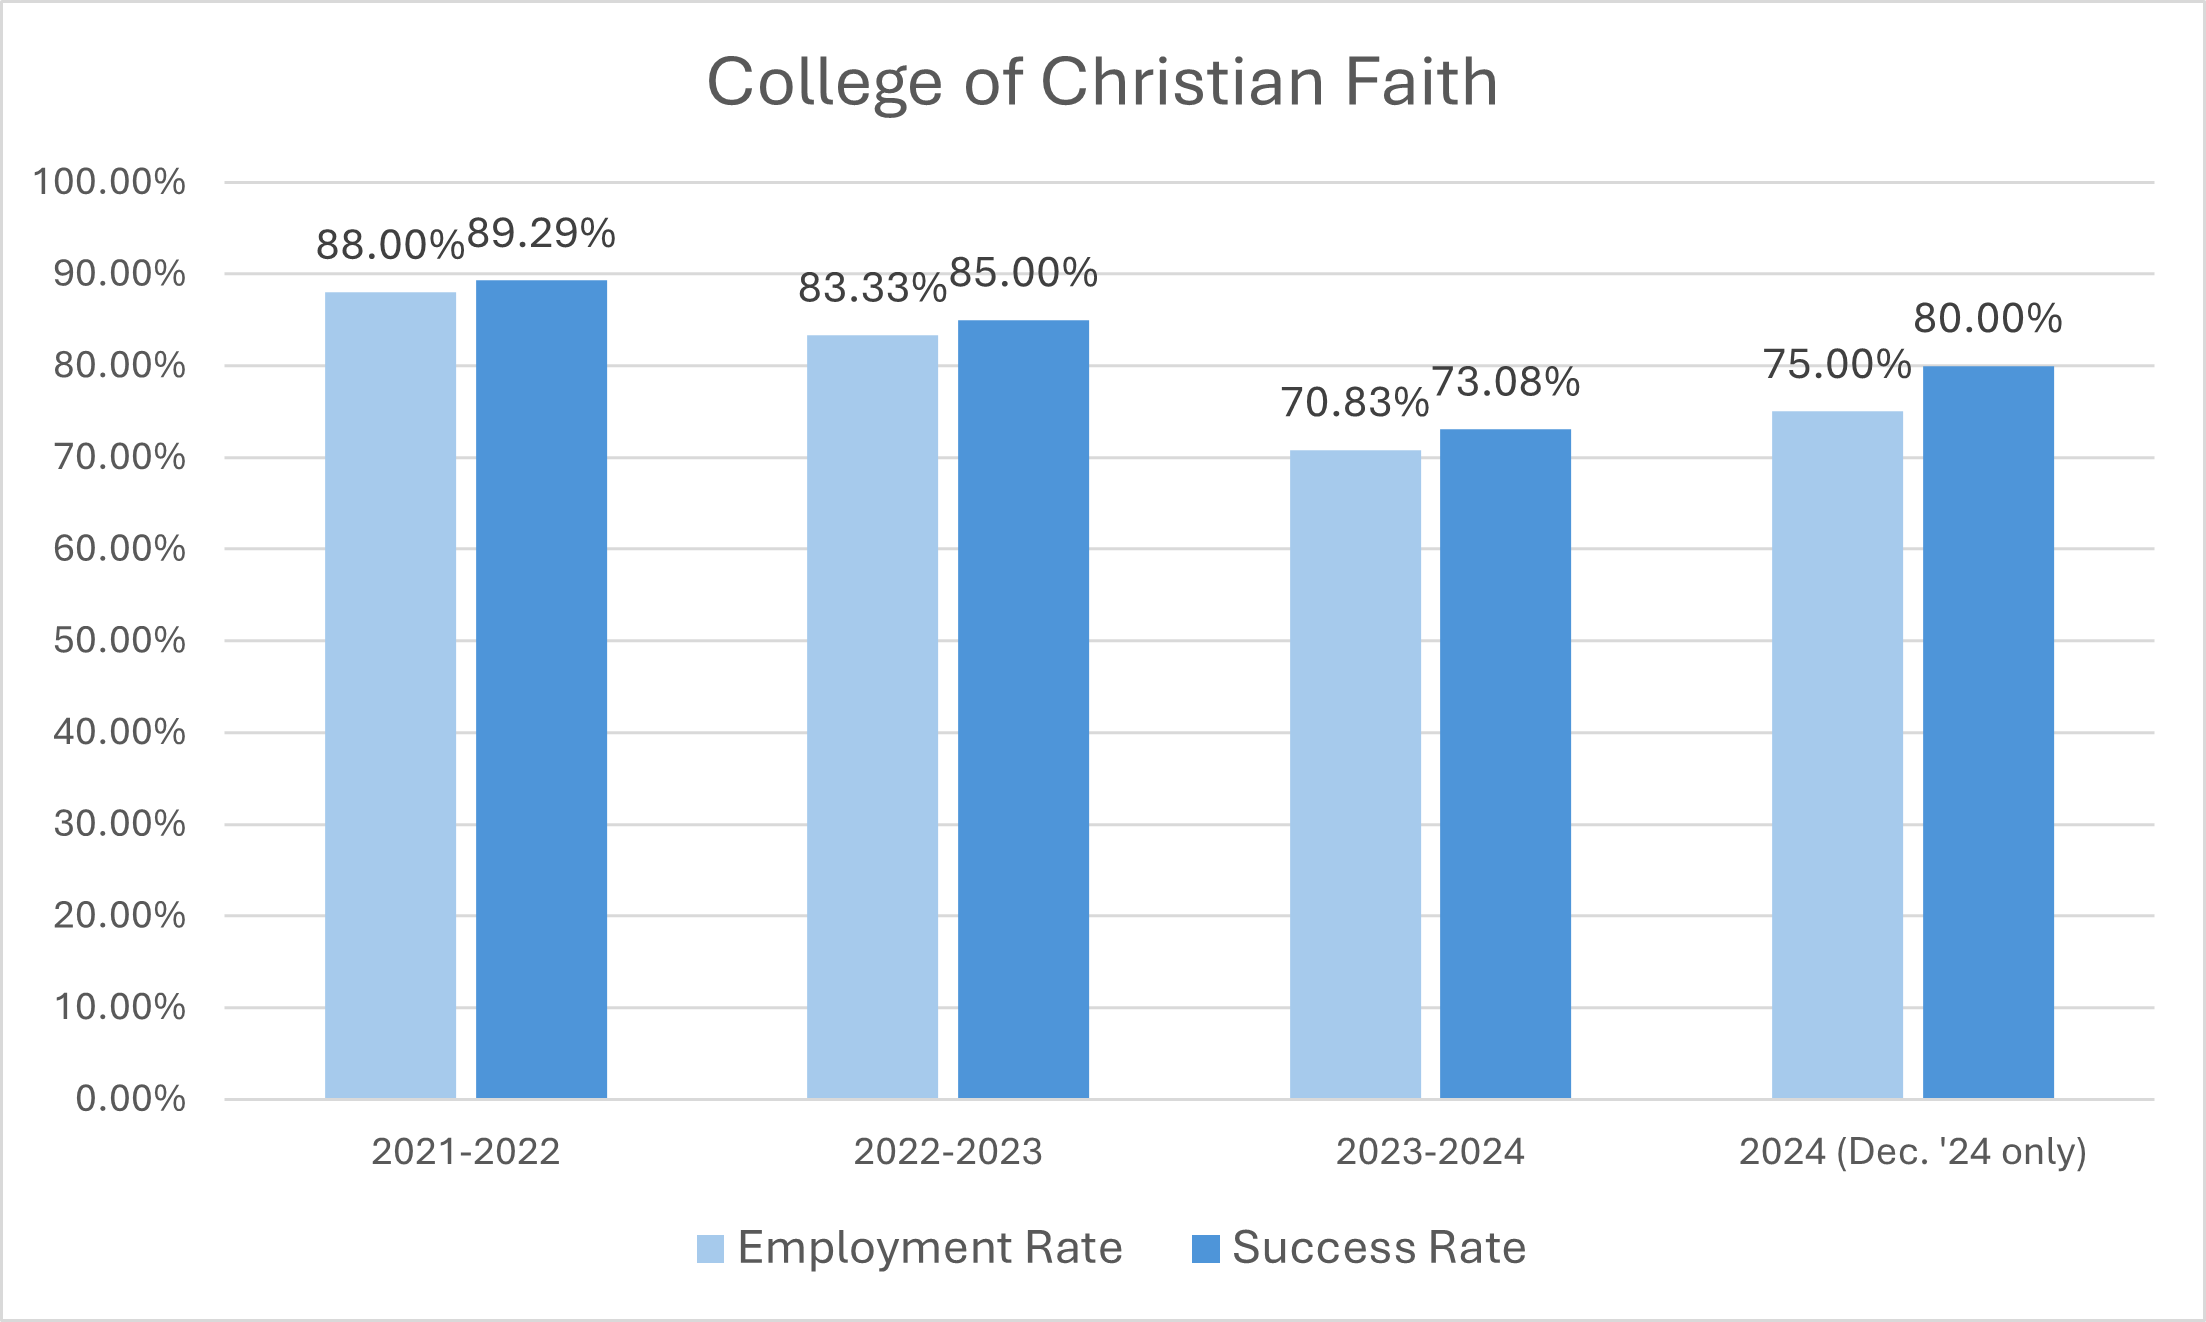
College of Christian Faith Employment Data
Minimum Threshold of Accountability: The Crowley College of Christian Faith has established a minimum threshold of acceptability for its employment rate of 60%.
The Goal for Achievement: The Crowley College of Christian Faith has established a goal of 70% for its employment rate starting with the Fall 2023 Cohort. The charts below show the cohort sizes and employment and success rates for graduates from the College of Christian Faith.
| Cohort Academic Year | COCF Graduates |
|---|---|
| 2021-2022 | 32 |
| 2022-2023 | 27 |
| 2023-2024 | 35 |
| 2024-2025 | 31 |
*Employment Rates—(# students reporting employment) / (# students reporting employment + # students reporting they are seeking employment)
*Success Rates—(# students reporting employment + # students reporting employment within three months + # students reporting acceptance into graduate school) / (# students reporting employment + # students reporting employment within three months + # students reporting acceptance into graduate school + # students reporting they are seeking employment + # students reporting they are seeking acceptance into graduate school)
Narrative: For the 2024-2025 academic year, students in the Crowley College of Christian Faith reported an employment rate of 84.21% with a Success Rate of 86.36%, exceeding the goal for achievement.
Graduate School of Ministry Graduation and Employment Rates
Graduate School of Ministry Program Graduation Rates
Minimum Threshold of Acceptability: The Graduate School of Ministry has established a minimum threshold of acceptability for its overall 3-year graduation rate of 40%.
The Goal for Achievement: The Graduate School of Ministry has established a goal of 60% for its 3-year graduation rate for the Fall 2025 Cohort.
| Year | Original Cohort | Graduated | GR Rate 150% |
|---|---|---|---|
| Fall 2014 | 68 | 25 | 36.8% |
| Fall 2015 | 98 | 46 | 46.9% |
| Fall 2016 | 63 | 32 | 50.8% |
| Fall 2017 | 79 | 42 | 53.2% |
| Fall 2018 | 94 | 47 | 50.0% |
| Fall 2019 | 53 | 36 | 67.9% |
| Fall 2020 | 54 | 23 | 42.6% |
| Fall 2021 | 53 | 27 | 50.9% |
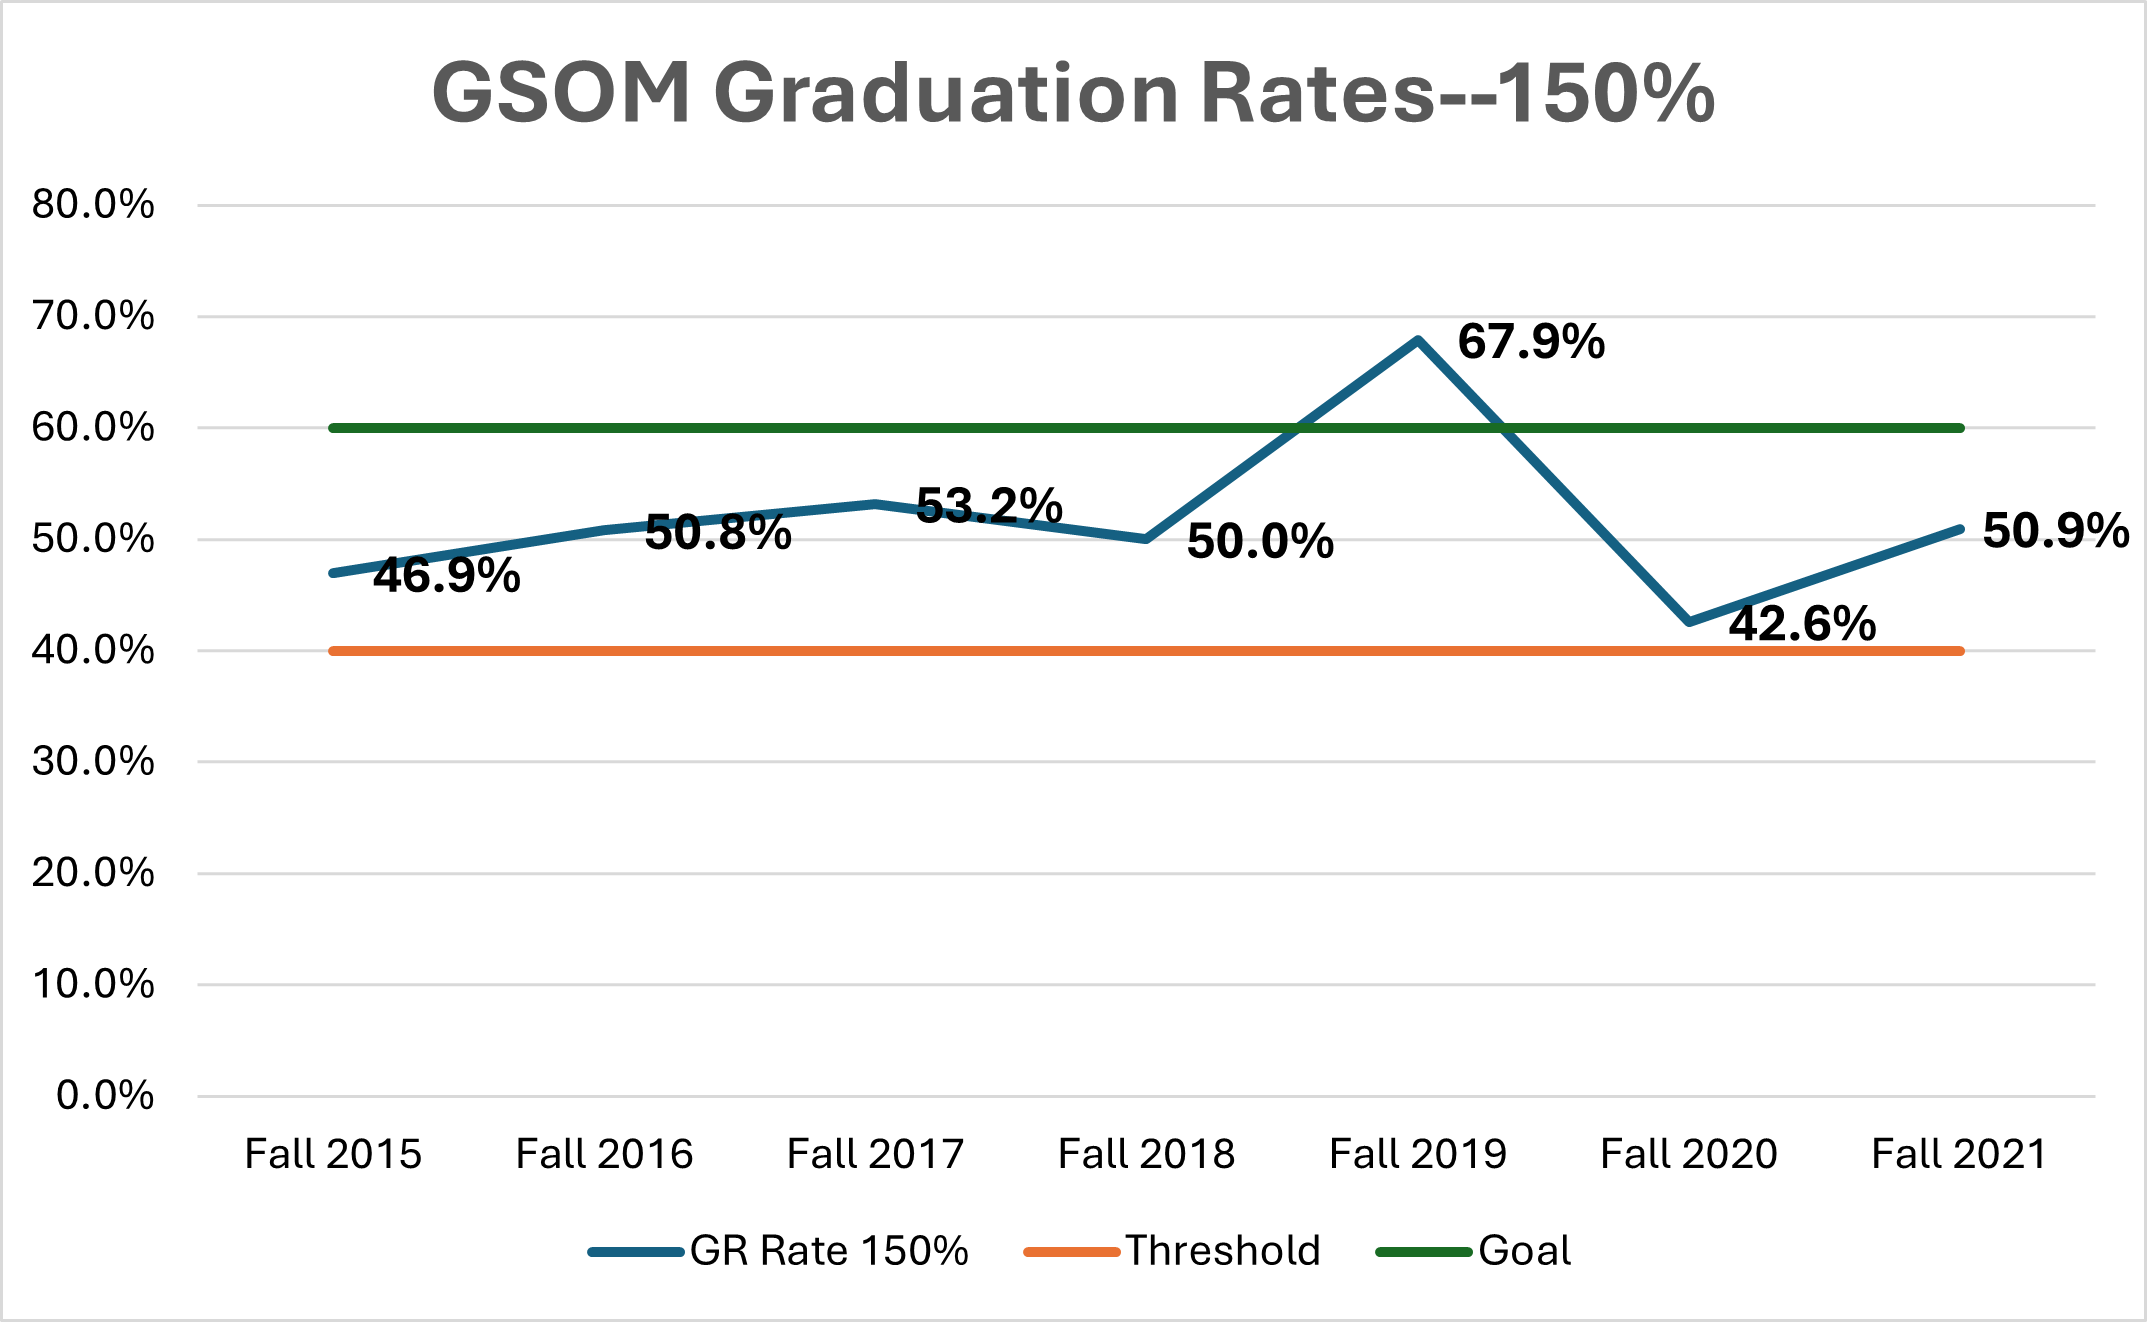
Narrative: The Graduate School of Ministry had an average 3-year graduation rate of 51.8% over the six cohorts beginning with Fall 2015. This average exceeds the minimum threshold but does not yet meet the established goal.
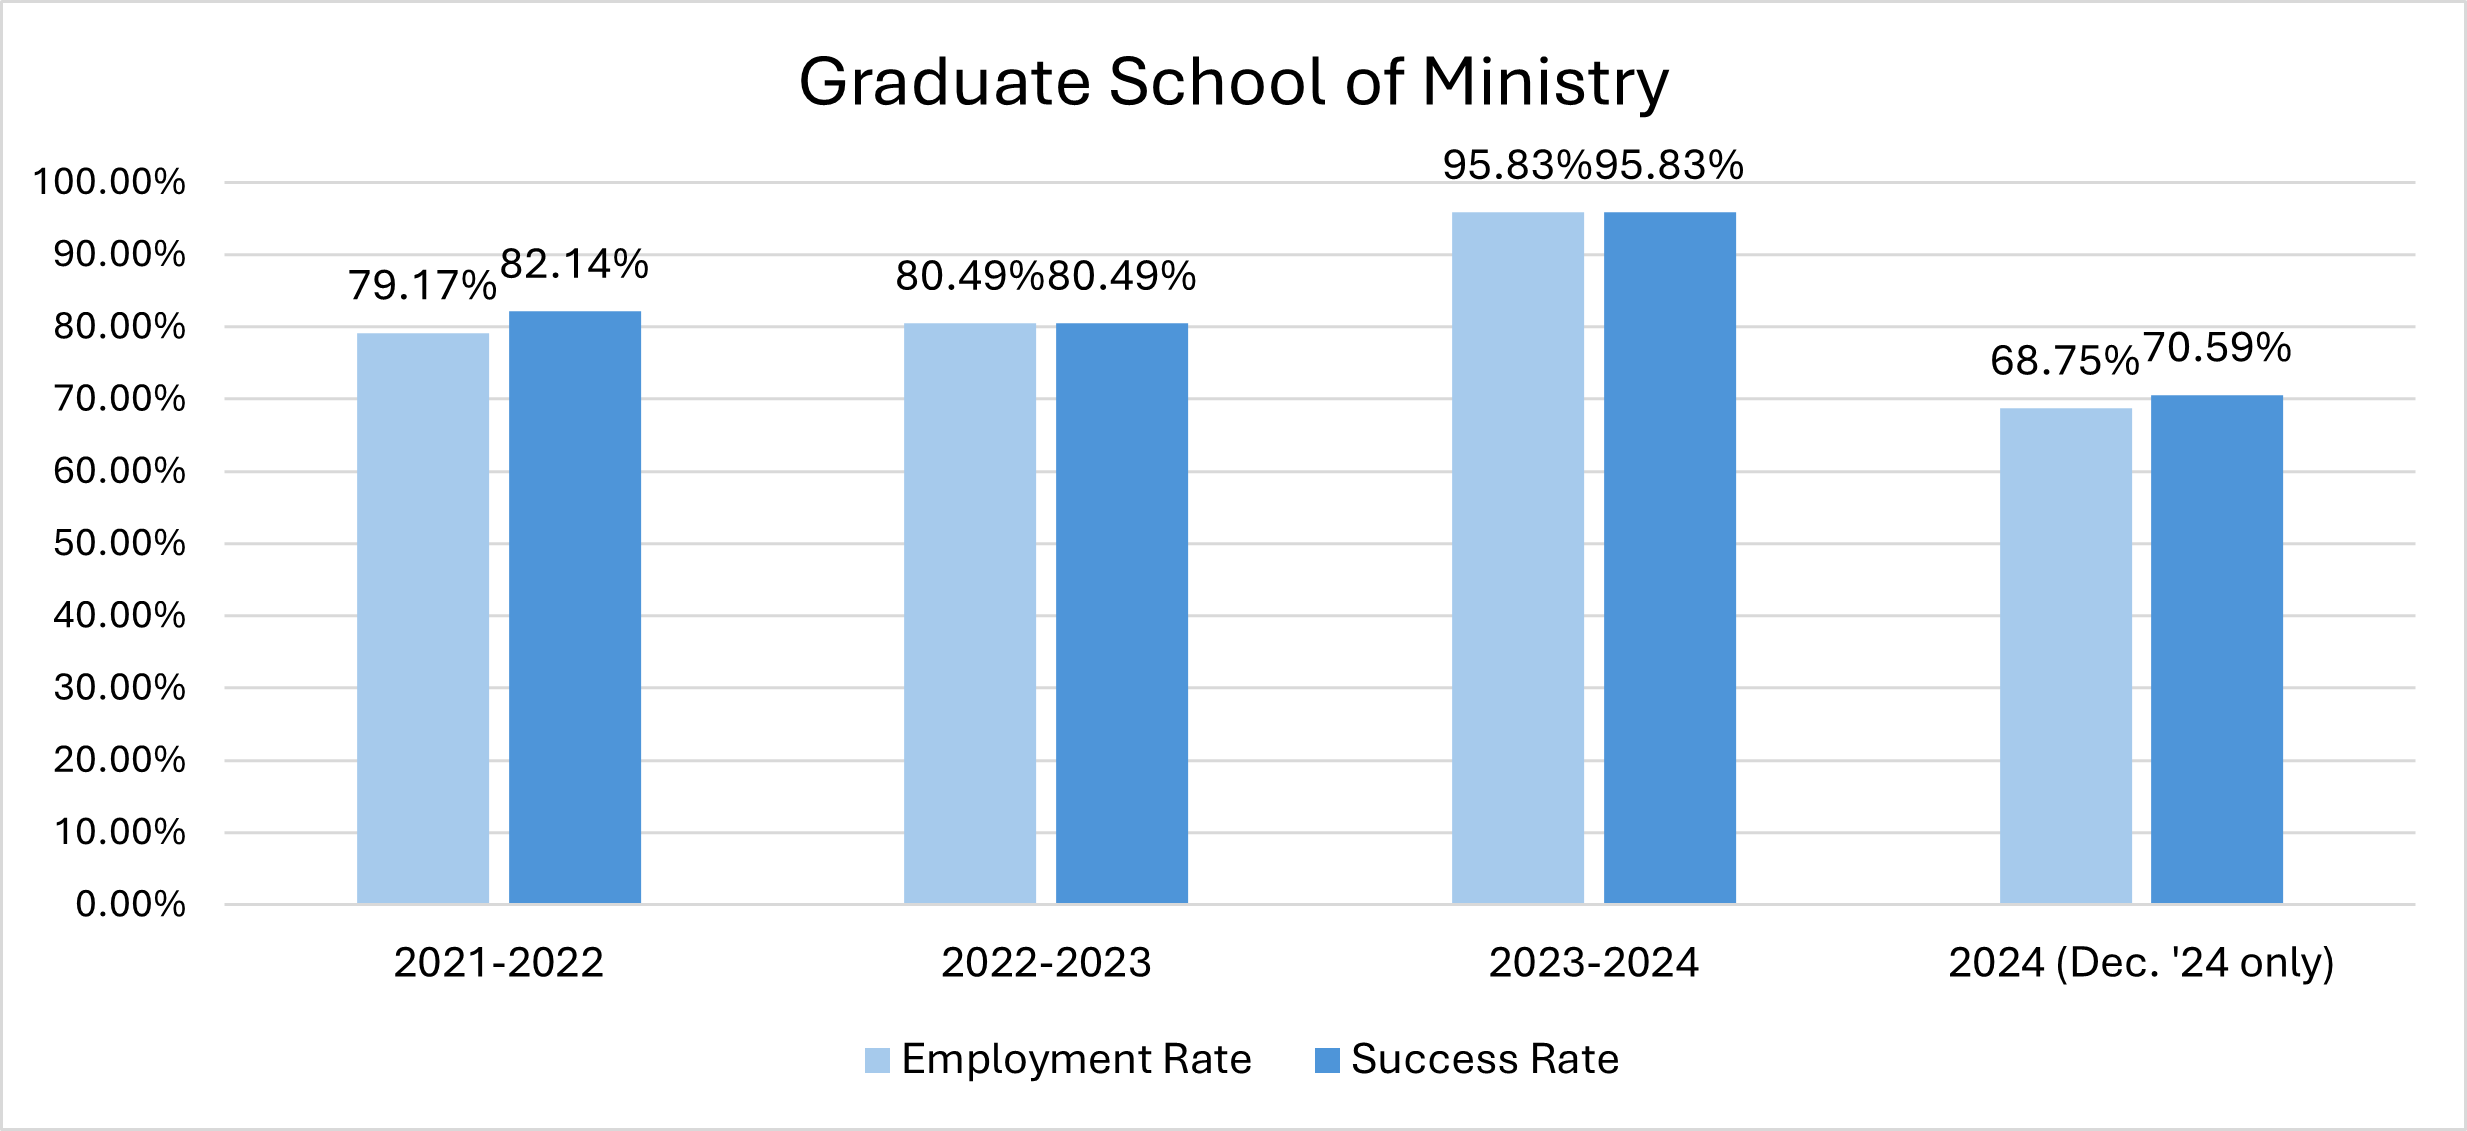
Graduate School of Ministry Program Employment Rates
Minimum Threshold of Acceptability: The Graduate School of Ministry has established a minimum threshold of acceptability for its employment rate of 60%.
The Goal for Achievement: The Graduate School of Ministry has established a goal of 75% for its employment rate starting with the Fall 2023 Cohort. The charts below show the cohort sizes and employment and success rates for graduates from the Graduate School of Ministry.
| Cohort Academic Year | GSOM Graduates |
|---|---|
| 2021-2022 | 54 |
| 2022-2023 | 68 |
| 2023-2024 | 54 |
| 2024-2025 | 56 |
*Employment Rates—(# students reporting employment) / (# students reporting employment + # students reporting they are seeking employment)
*Success Rates—(# students reporting employment + # students reporting employment within three months + # students reporting acceptance into graduate school) / (# students reporting employment + # students reporting employment within three months + # students reporting acceptance into graduate school + # students reporting they are seeking employment + # students reporting they are seeking acceptance into graduate school)
Narrative: For the 2024-2025 academic year, students in the Graduate School of Ministry reported an employment rate of 85.00% with a Success Rate also of 85.71%, exceeding the goal for achievement.
Cook School of Leadership Graduation and Employment Rates
Cook School of Leadership Graduation Rates
Minimum Threshold of Accountability: The Cook School of Leadership offers three different programs—a Doctorate of Philosophy (PhD), a Doctorate of Education (EdD), and several master’s degrees. They have established a minimum threshold of acceptability for graduation rates within 150% of normal time of 40% for all programs.
The Goal for Achievement: The Cook School of Leadership has established a goal of 60% at 150% of normal time for its graduation rates for all degrees for the Fall 2025 Cohorts.
| EdD (4.5-year rates) | PhD (6-year rates) | Masters (3-year rates) | |||||||
|---|---|---|---|---|---|---|---|---|---|
| Cohort | Graduated | GR Rate 150% | Cohort | Graduated | GR Rate 150% | Cohort | Graduated | GR Rate 150% | |
| Fall 2014 | 12 | 6 | 50.0% | 13 | 6 | 46.2% | 15 | 11 | 73.3% |
| Fall 2015 | 13 | 6 | 46.2% | 18 | 8 | 44.4% | 32 | 14 | 43.8% |
| Fall 2016 | 10 | 6 | 60.0% | 17 | 5 | 29.4% | 25 | 13 | 52.0% |
| Fall 2017 | 6 | 1 | 16.7% | 19 | 8 | 42.1% | 21 | 10 | 47.6% |
| Fall 2018 | 10 | 6 | 60.0% | 20 | 20 | 45.0% | 25 | 15 | 60.0% |
| Fall 2019 | 19 | 6 | 31.6% | 17 | 8 | 47.1% | |||
| Fall 2020 | 11 | 3 | 27.3% | 21 | 11 | 52.4% | |||
| Fall 2021 | 12 | 9 | 4 | 44.4% | |||||
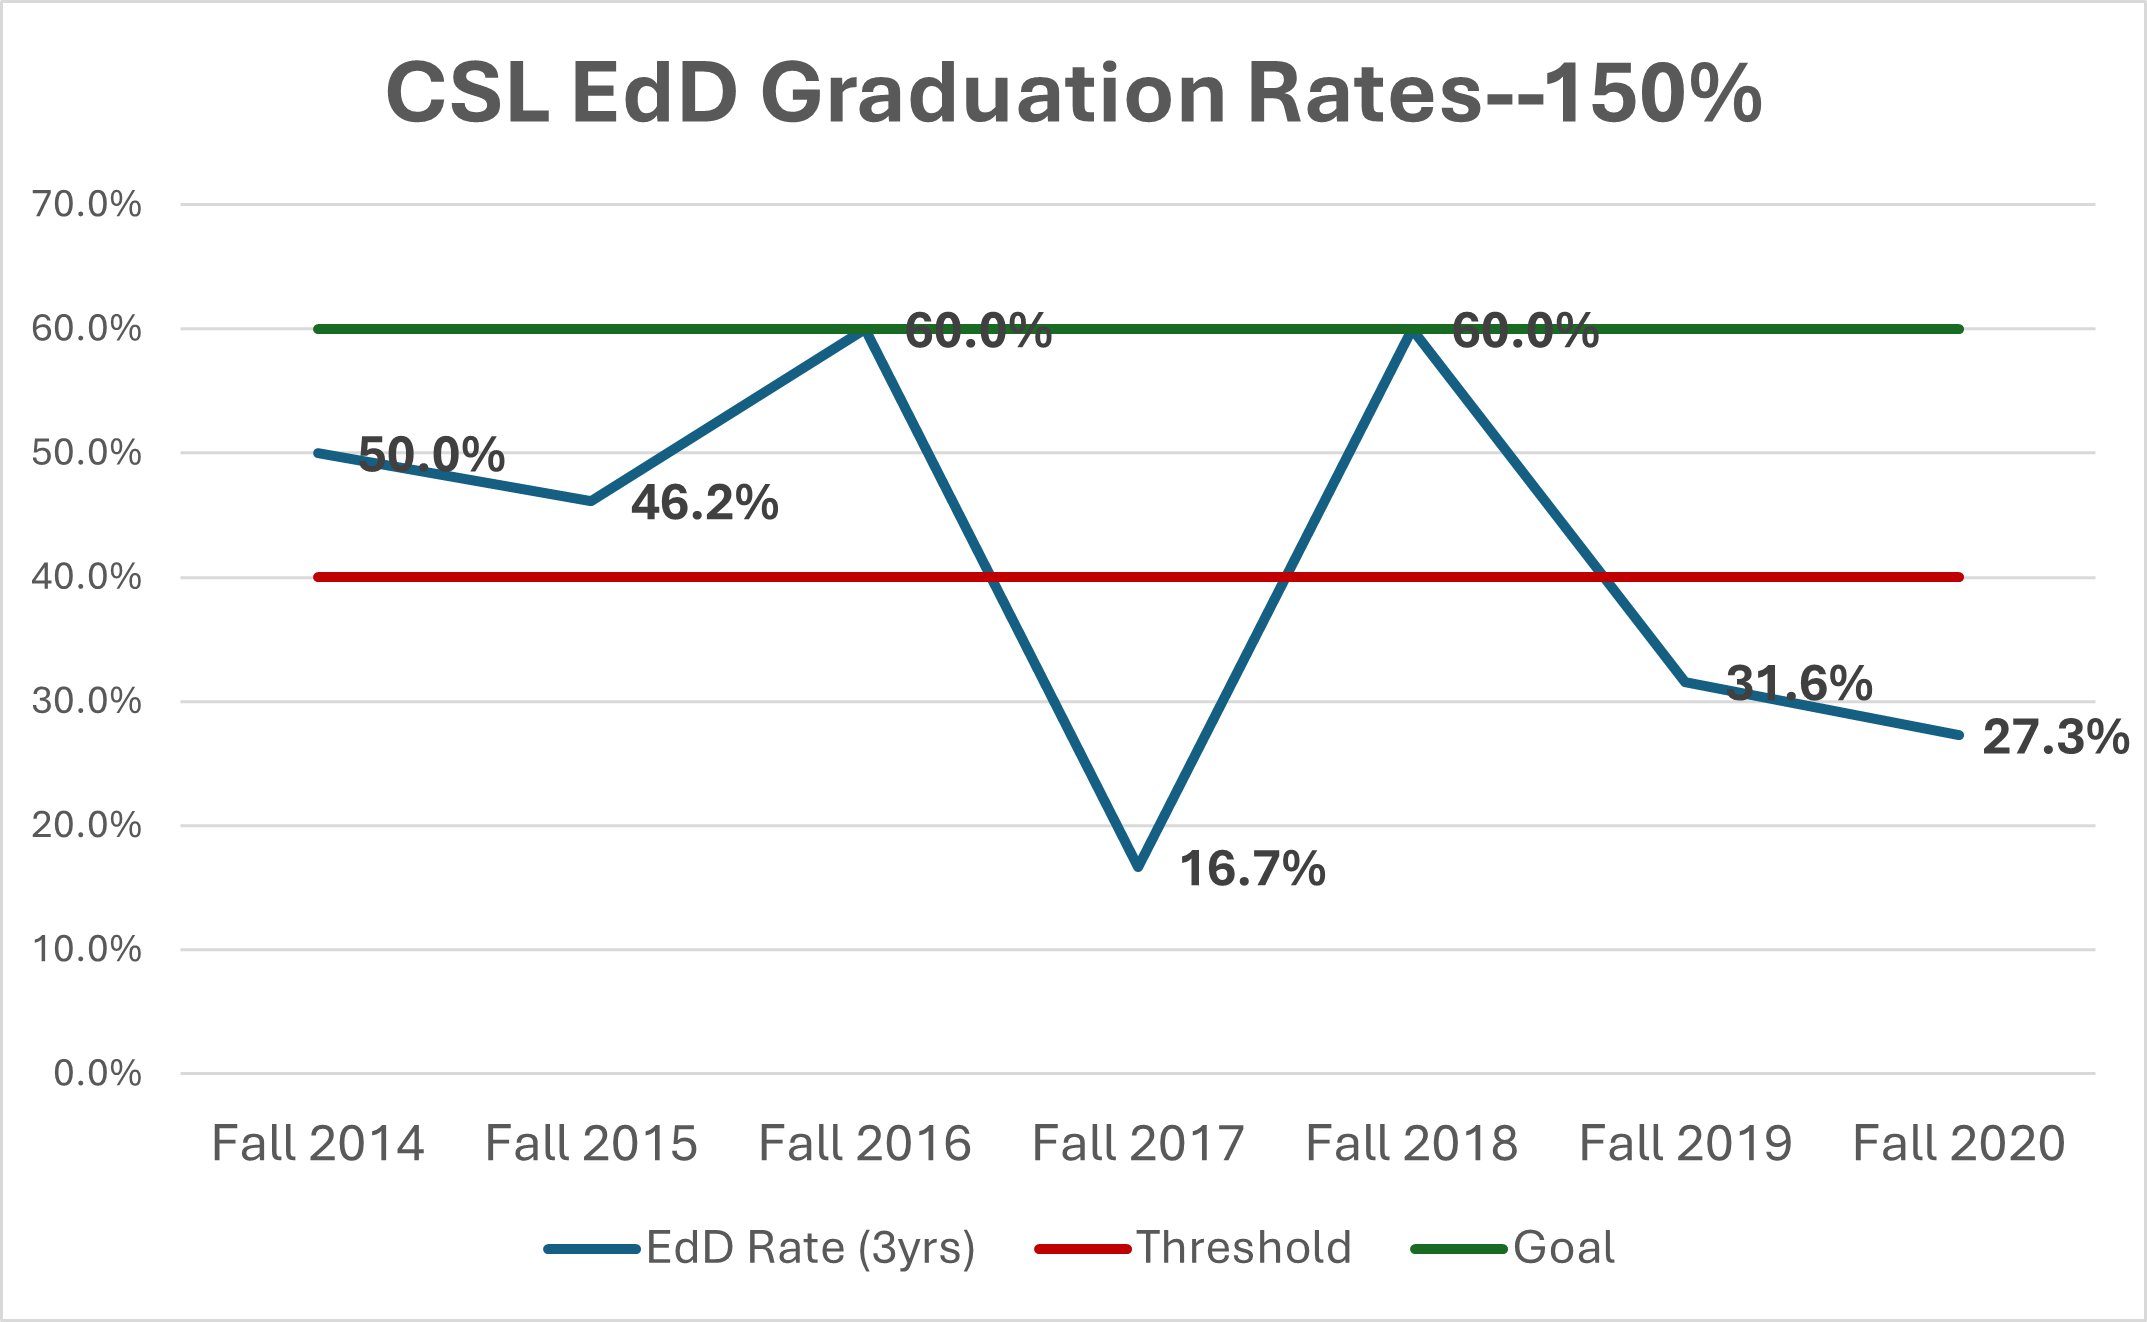
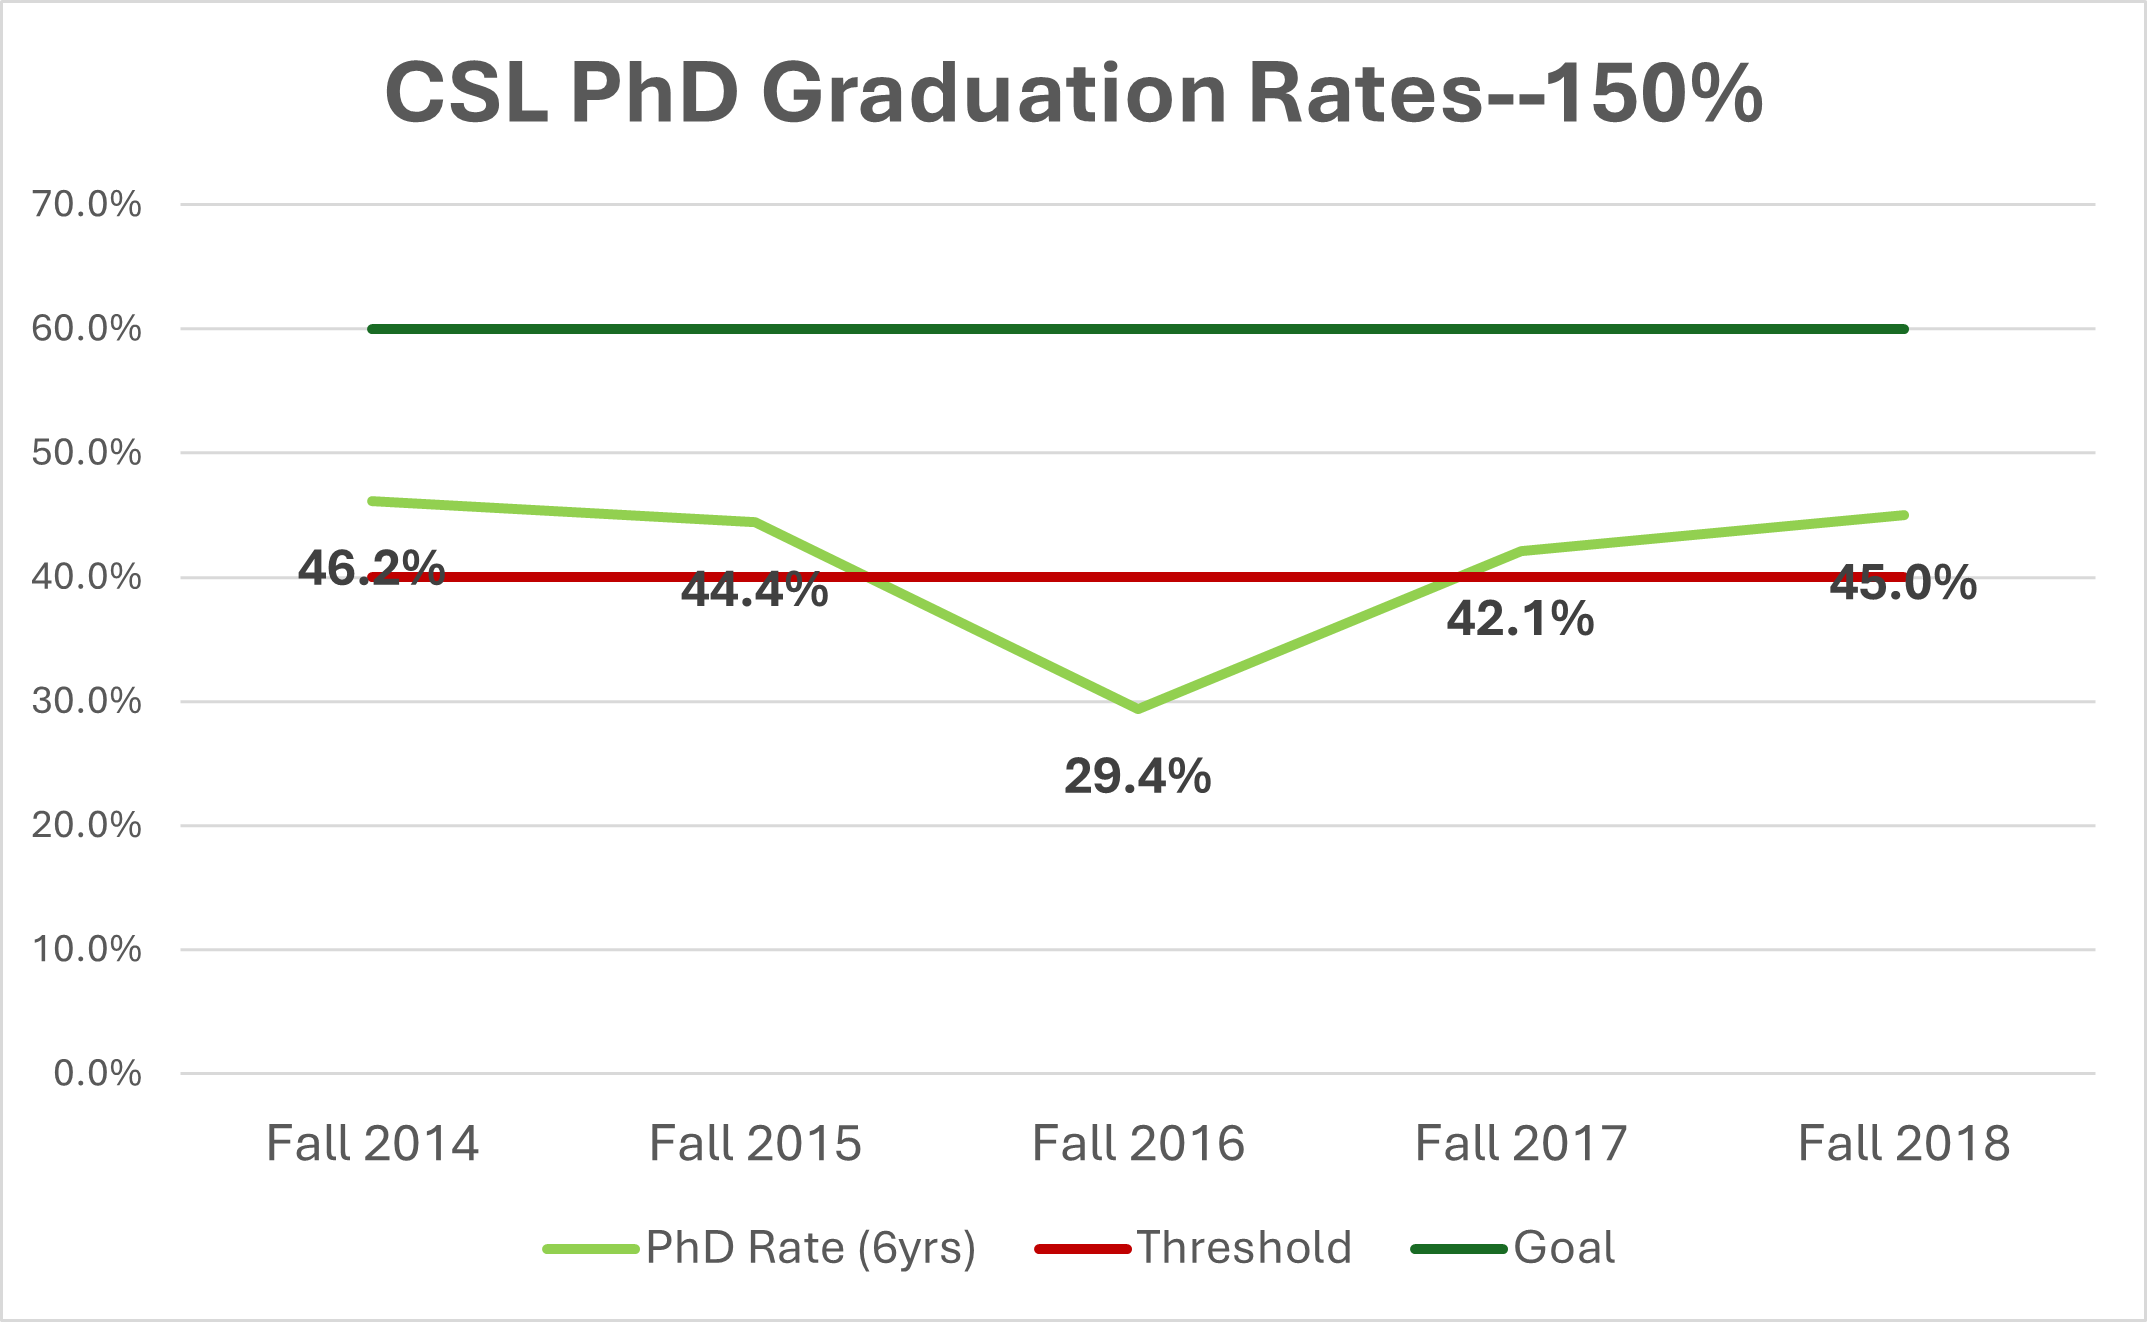
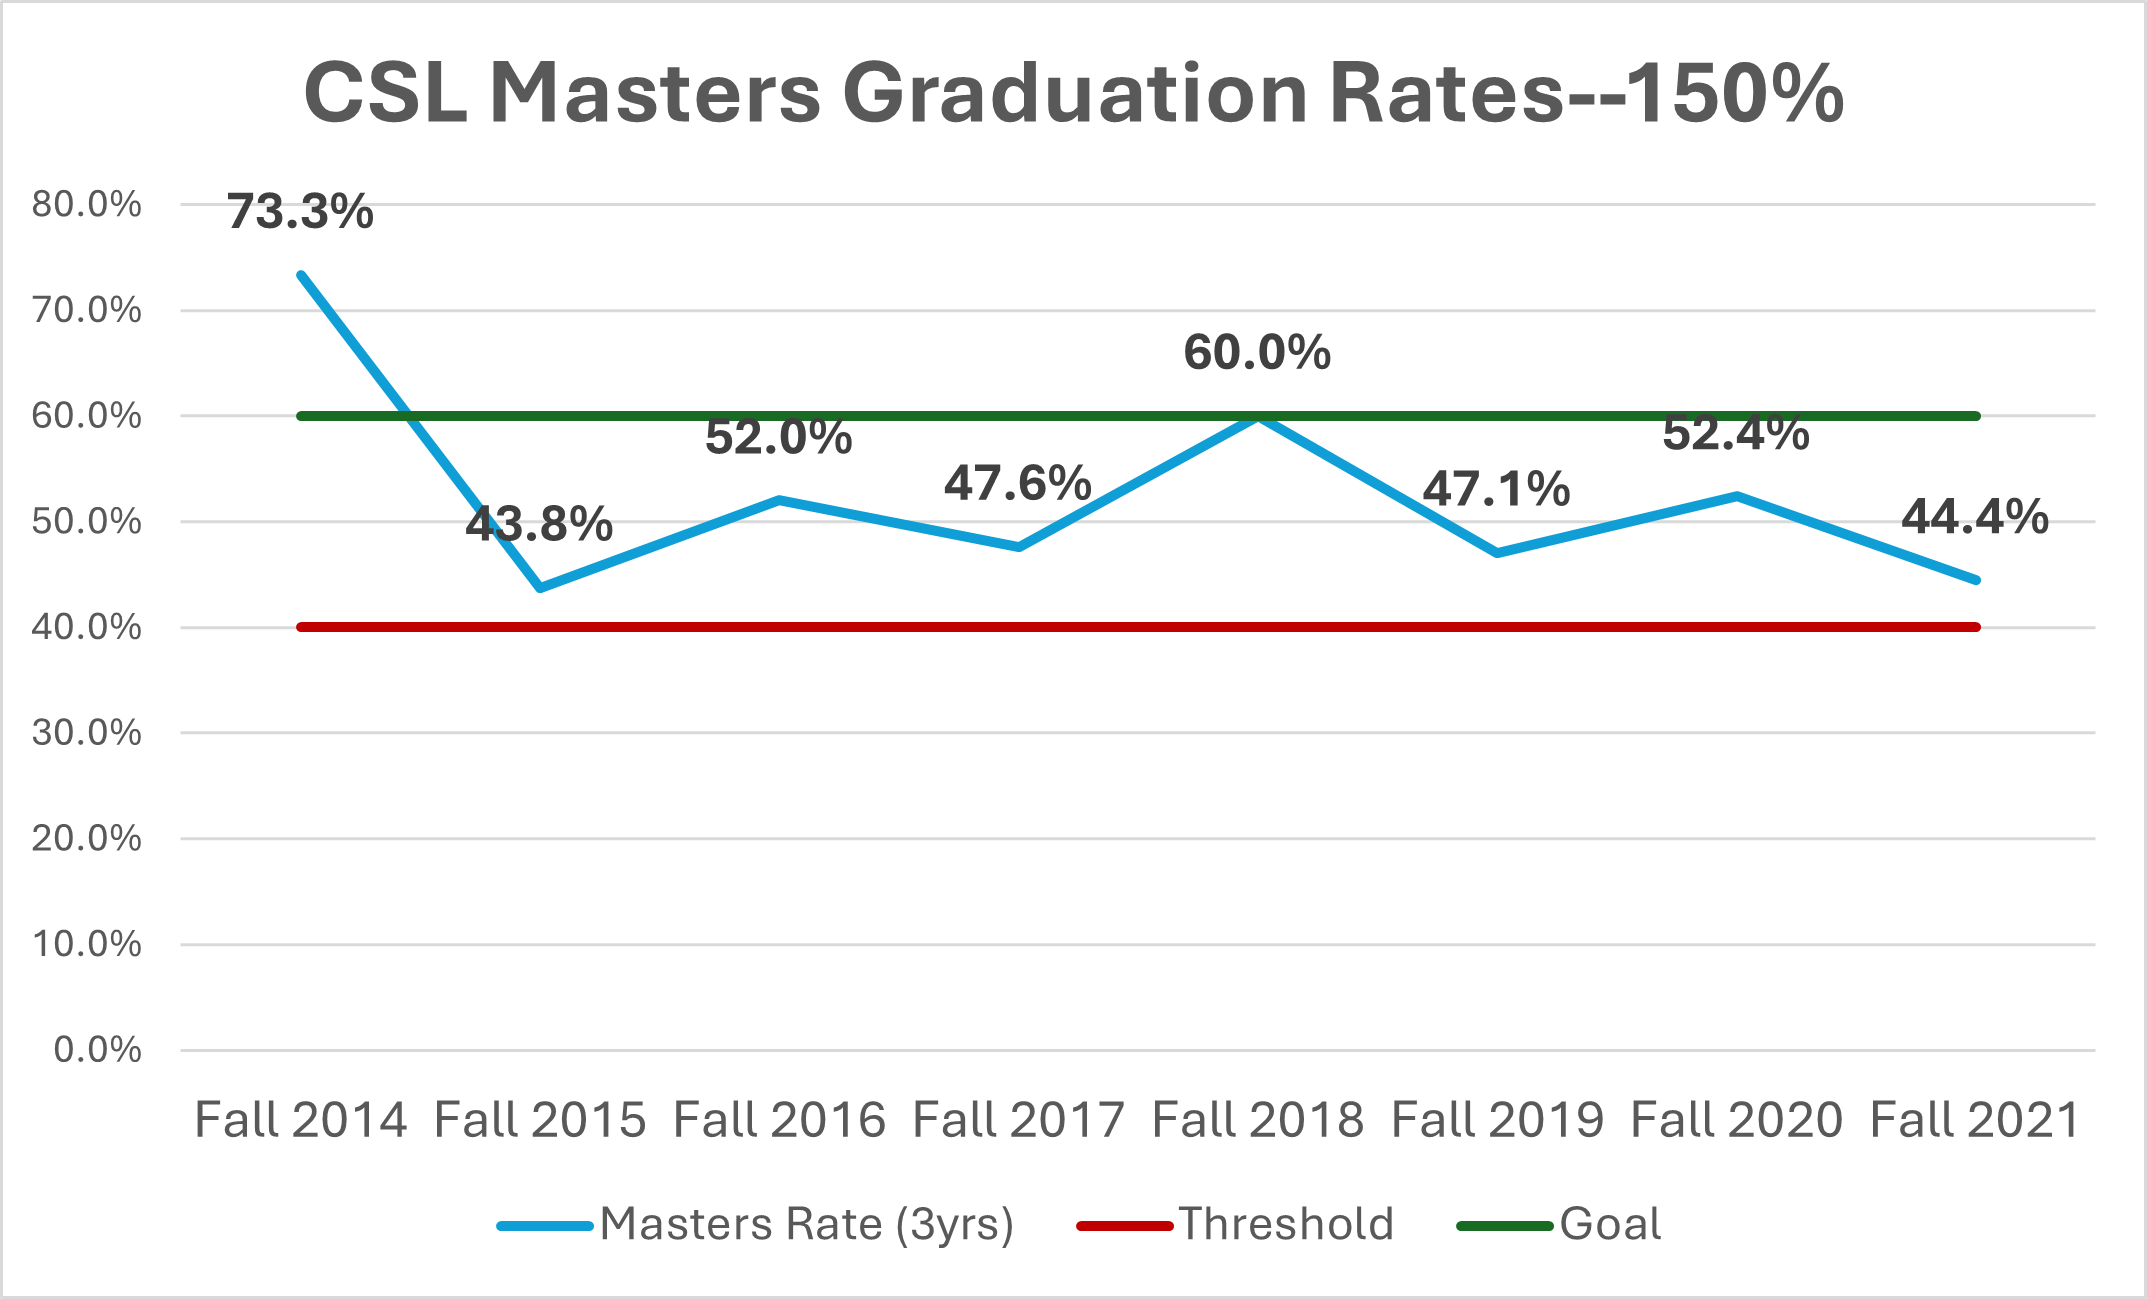
Narrative: Since 2014 all three programs have averaged a graduation rate that exceeds the minimum threshold—EdD average rate of 41.7%, PhD average rate of 41.4%, and master’s programs average rate of 52.6%--and while the goal of 60% has been achieved at times, it has not been sustained. The recent downturn in the EDD graduation rate to below the minimum threshold is being addressed through a complete curriculum redesign.
Cook School of Leadership Employment Rates
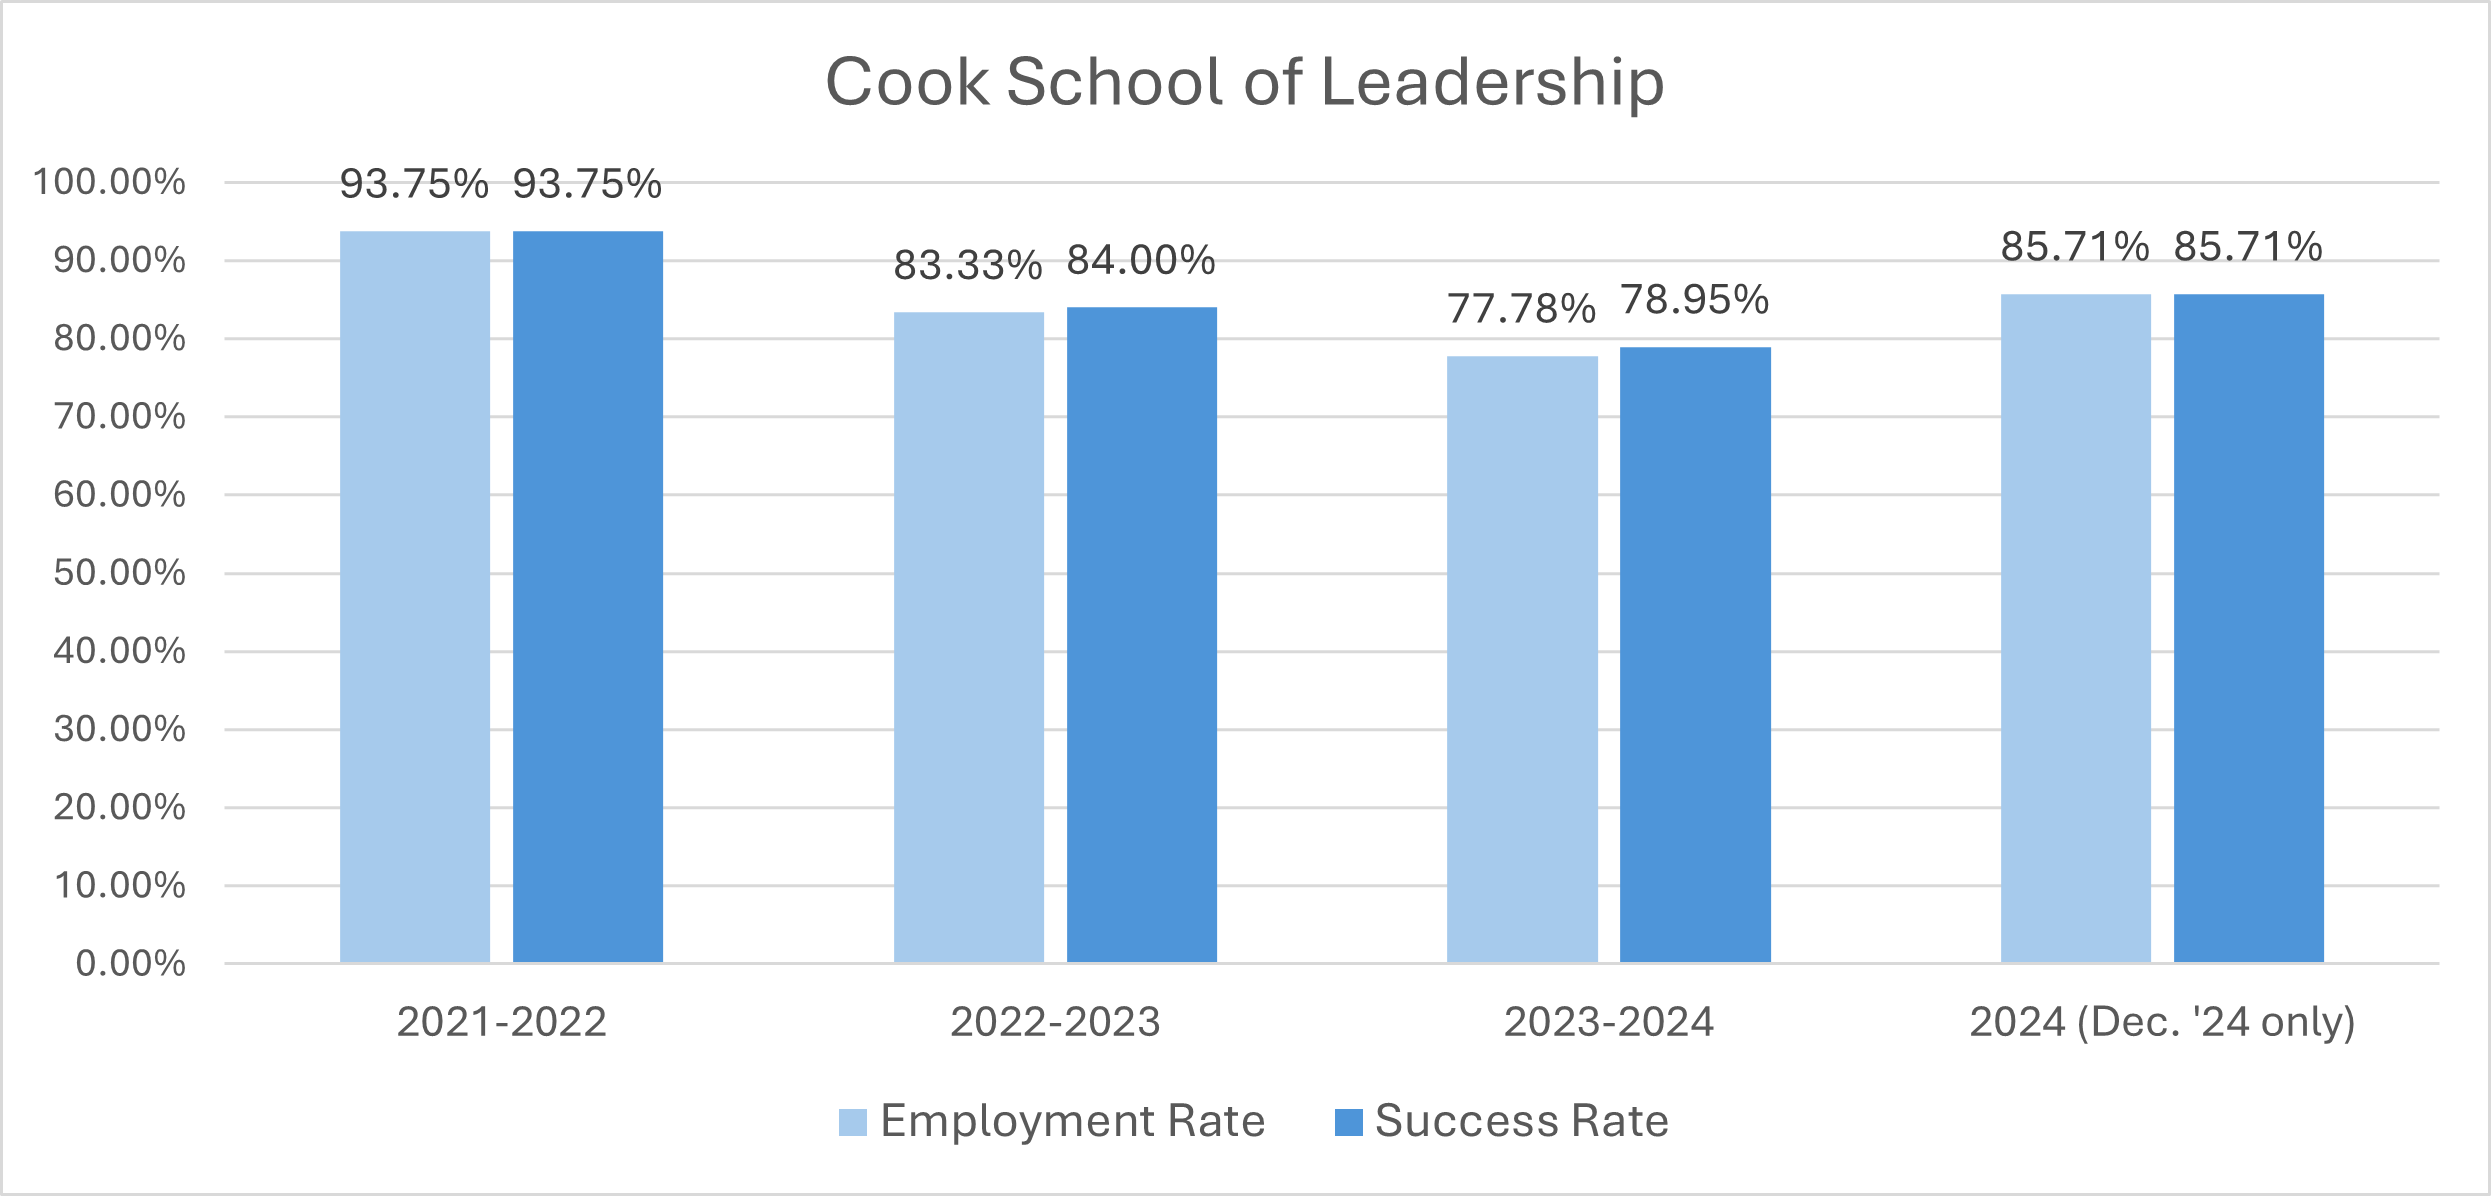
Minimum Threshold of Accountability: The Cook School of Leadership has established a minimum threshold of acceptability for its employment rate of 60%.
The Goal for Achievement: The Cook School of Leadership has established a goal of 75% for its employment rate starting with the Fall 2023 Cohort. The charts below show the cohort sizes and employment and success rates for graduates from the Cook School of Leadership.
| Cohort Academic Year | CSL Graduates |
|---|---|
| 2021-2022 | 47 |
| 2022-2023 | 37 |
| 2023-2024 | 36 |
| 2024-2025 | 47 |
*Employment Rates—(# students reporting employment) / (# students reporting employment + # students reporting they are seeking employment)
*Success Rates—(# students reporting employment + # students reporting employment within three months + # students reporting acceptance into graduate school) / (# students reporting employment + # students reporting employment within three months + # students reporting acceptance into graduate school + # students reporting they are seeking employment + # students reporting they are seeking acceptance into graduate school)
Narrative: For the 2024-2025 academic year, students in the Cook School of Leadership reported an employment rate of 90.91% with a Success Rate of 91.18%, exceeding the goal for achievement.