Assessment Report
Data Which Are Representative of the Carter School of Business
The Carter School of Business (CSOB) at Dallas Baptist University recognizes the importance of assessing student learning for the purpose of continuous improvement of undergraduate and graduate business programs. In addition to measuring student learning, we assess other important indicators related to operational performance, stakeholder satisfaction, faculty and staff focus, and support activities.
The Council for Higher Education Accreditation (CHEA) has required that all institutions accredited by the Accreditation Council for Business Schools and Programs (ACBSP) make assessment data available to the public. Although the requirement does not mandate that the institution post all assessment data, it does "require institutions or programs routinely to provide reliable information to the public on their performance, including student achievement as determined by the institution or program."
The Dallas Baptist University Carter School of Business invites you to peruse the data we have collected regarding our program. The following data are not comprehensive but are representative of the data we analyze for quality assurance and continuous improvement of our program. A sample of the following data is presented next:
- Major Field Test (MFT) results
- Student retention rates
- Graduation rates
- Student satisfaction results
Major Field Test Results
Major Field Test is an external assessment indicator created by the Educational Testing Service (ETS) and administered across colleges in the United States. Major Field Test (MFT) is designed to measure students’ knowledge and understanding of their major field of study. It strives to measure students’ ability to apply facts, concepts, theories and analytical methods to answer 120 multiple-choice questions over a 2-hour period. Typically, students take the exam as part of the designated business course in their final semester.
The results are presented for both undergraduate and graduate programs. Major Field Test on the undergraduate level tests nine distinct subject areas, while the graduate version tests only five. The scores represent mean percent of correctly answered questions for the given subject matter on the test.
Undergraduate Programs
Major Field Test Results
- Accounting: 42
- Economics: 50
- Management: 59
- Quantitative Business Analysis: 34
- Finance: 42
- Marketing: 58
- Legal and Social Environment: 52
- Information Systems: 39
- International Issues: 43
Major Field Test Results
- Accounting: 41
- Economics: 52
- Management: 56
- Quantitative Business Analysis: 34
- Finance: 42
- Marketing: 53
- Legal and Social Environment: 48
- Information Systems: 44
- International Issues: 40
Major Field Test Results
- Accounting: 38
- Economics: 47
- Management: 53
- Quantitative Business Analysis: 29
- Finance: 41
- Marketing: 52
- Legal and Social Environment: 46
- Information Systems: 35
- International Issues: 41
Major Field Test Results
- Accounting: 43
- Economics: 55
- Management: 59
- Quantitative Business Analysis: 42
- Finance: 40
- Marketing: 54
- Legal and Social Environment: 51
- Information Systems: 39
- International Issues: 44
MFT Scores by Discipline for Undergraduate Students
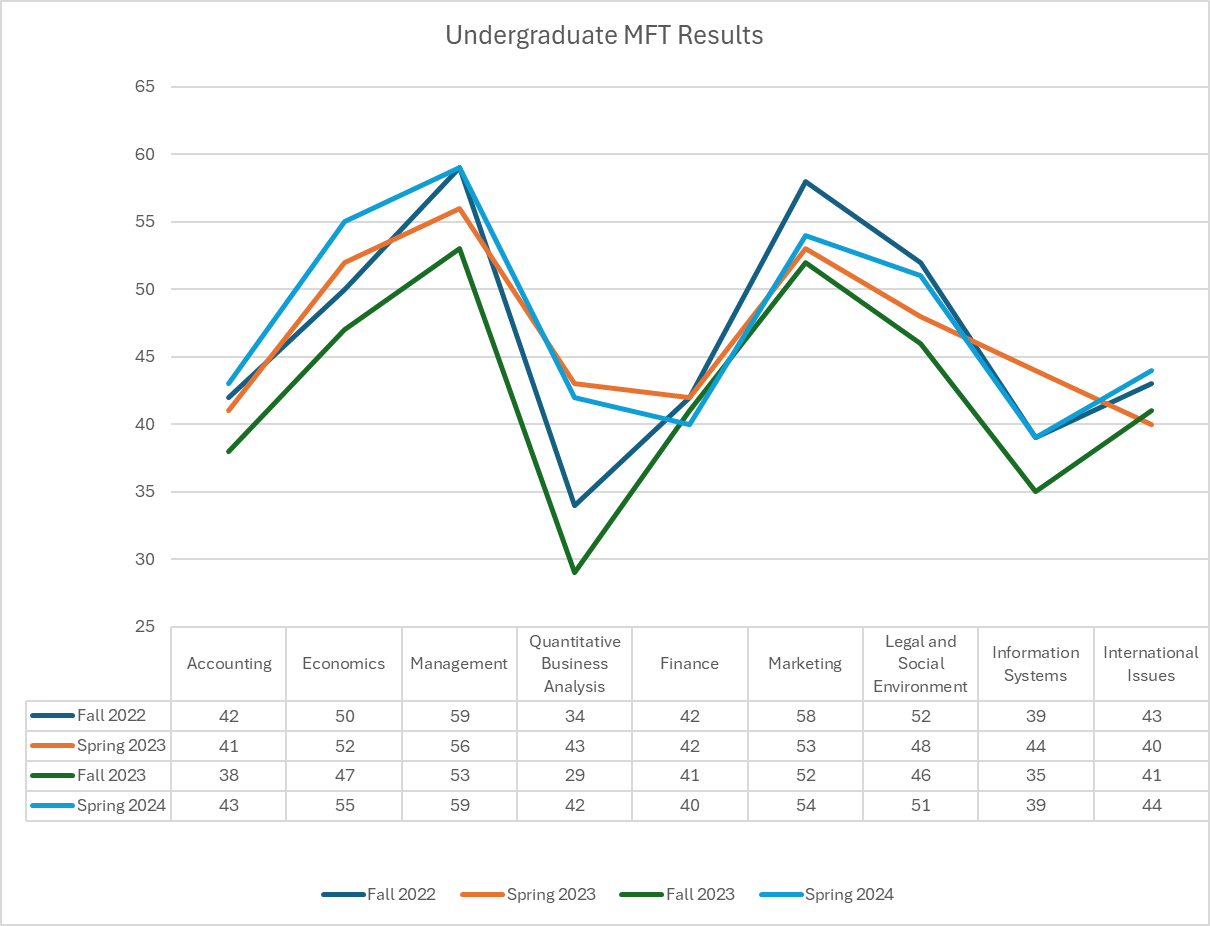
For undergraduate MFT scores, the trend has generally increased with Fall 2022 showing the highest improvement across all subject matters. The highest scores were in management and the lowest in quantitative business analysis.
Graduate Programs
Major Field Test Results
- Marketing: 57
- Management: 53
- Finance: 34
- Accounting: 34
- Strategic Integration: 47
Major Field Test Results
- Marketing: 55
- Management: 49
- Finance: 35
- Accounting: 36
- Strategic Integration: 43
Major Field Test Results
- Marketing: 57
- Management: 50
- Finance: 31
- Accounting: 35
- Strategic Integration: 45
Major Field Test Results
- Marketing: 55
- Management: 48
- Finance: 29
- Accounting: 34
- Strategic Integration: 45
MFT Scores by Discipline for MBA Students
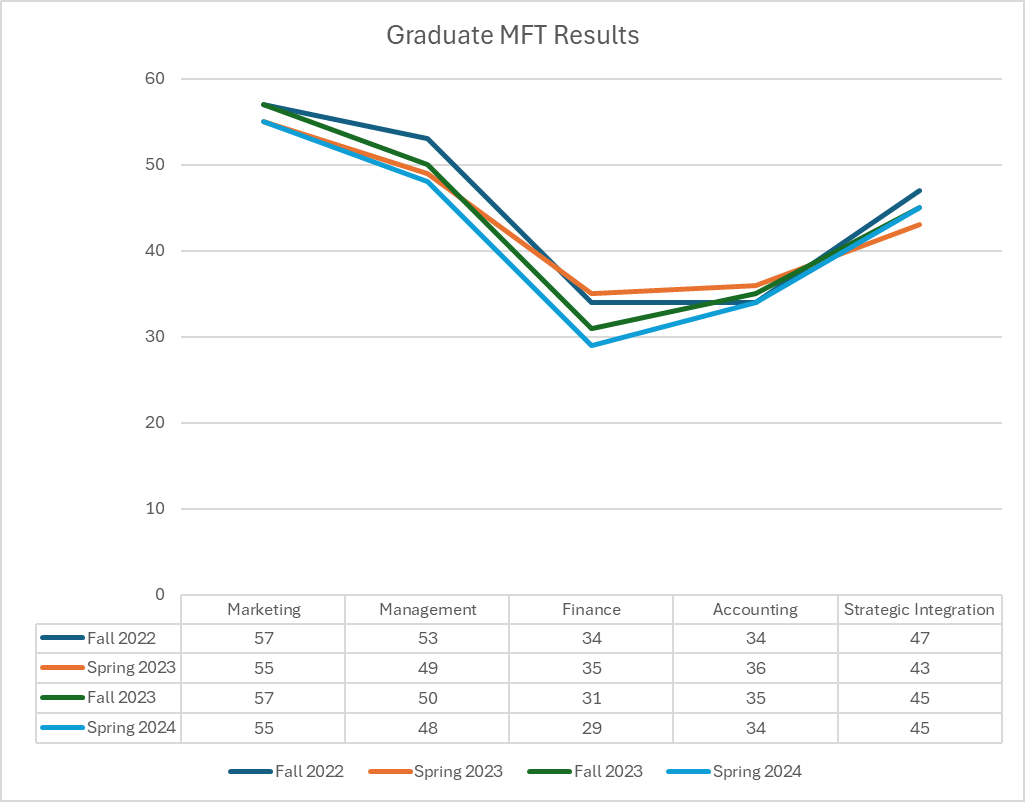
For graduate MFT results, the trend has generally increased in marketing and management from 2021-2023, and remained relatively stable in finance, accounting, and strategic integration during the same period. The highest scores are observed in management and marketing fields and the lowest in finance. Changes are currently being implemented at the MBA level to increase students' ability to analyze, problem solve, understand relationships, and interpret material relevant to the MBA course of study.
Student Retention Rates
Retention rates can reveal certain things about a program:
- The Carter School of Business (CSOB), at both the undergraduate and graduate levels, has faculty who engage students. Students need professors who are willing to invest in them academically, spiritually, and professionally. The goal of the CSOB is to ensure that courses taught online receive the same priority and attention as in-person courses. It is important for our professors to respond quickly and appropriately to student questions and needs. When faculty are engaging, helpful, and encouraging, most students will stay with a program and ultimately graduate.
- When students' academic and social needs are being met by the program, they will develop a connection with the coursework, faculty, and other students in the program which increases the likelihood that they will complete the program. The academic needs may be obvious, the social needs less so. Many undergraduate students live on campus, and even those who live off campus will spend a great number of hours on campus. When a university and a program provide forums for social interaction, facilities for campus-based activities, and opportunities for service-learning and community interaction, students feel fulfilled and needed. When students believe that the university and program support their academic and social needs, graduation is the ultimate achievement that encapsulates their entire experience.
- Faculty members who encourage students to persevere in the program until completion communicate a belief in the ability of the student to succeed. When students see for themselves that classmates, friends, and cohorts are graduating, they believe they also can achieve the goal of graduation.
- In the CSOB, effective advising and mentoring is available to every student to guide them on the path of fulfilling the requirements to graduate. Our degree plans, coupled with advising, provide a clear road map for reaching graduation. The CSOB advisors work with the best interest of the students in mind and do their best to remove any uncertainty about the future which bolsters the confidence of our students.
- As a university and program, our goal is to create a setting that fosters learning which should result in higher retention rates. Students have a thirst for knowledge that draws them to higher education. When an institute of higher education creates an atmosphere that encourages life-long learning, students will respond by completing degrees and other educational goals.
The following is representative of the Carter School of Business retention rates.
- 2018-2019: 74%
- 2019-2020: 70%
- 2020-2021: 62%
- 2021-2022: 69%
- 2022-2023: 64%
- 2023-2024: 69.53%
Carter School of Business Retention Rate Across Programs
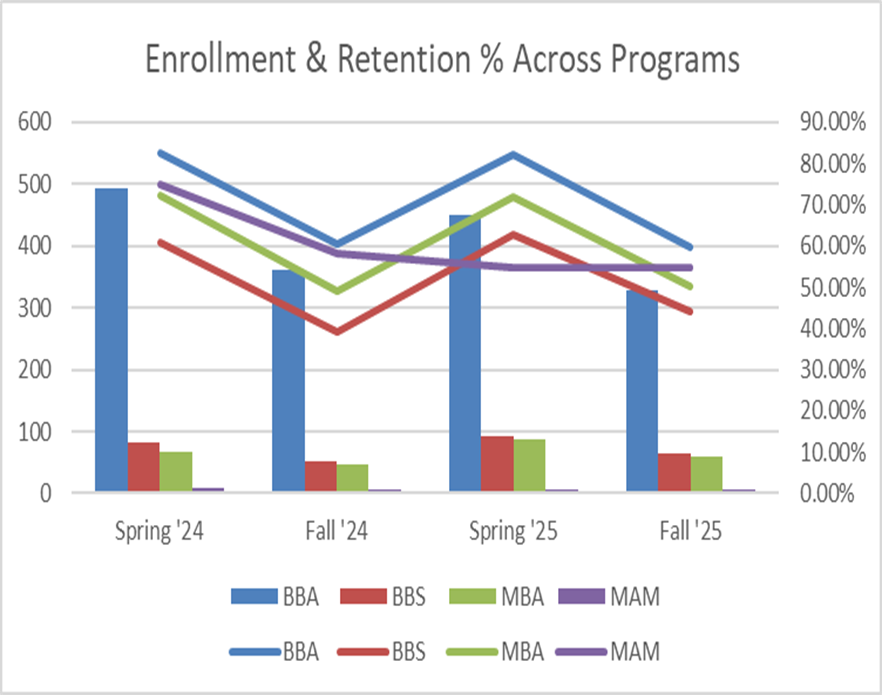
The combined retention rate for the four programs (BBA, BBS, MBA, and MAM) experienced fluctuation over the two-year period, averaging approximately 66.8% across the four semesters. The retention rate for BBA peaked near 78% in Spring '24 and then saw a decline to a low point in Fall '24, where program retention rates ranged from a low of about 40% (BBS) to a high of 60% (BBA). Following this drop, retention rates recovered in Spring '25, with the BBA program hitting its highest retention rate of approximately 85%, before all four programs experienced a moderate, synchronized decline again in Fall '25.
Graduation Rates for Carter School of Business Undergraduate Students
Graduation rates represent successful completion of the business program from start to finish. There are 3 cohorts of students which were analyzed from 2017-2023. At the undergraduate level, graduation rates are summarized in 4, 5, or 6 year completion times. Graduation rates within 4 years increased in 2018 and remained stable in 2019. The graduation rates within 5 years increased from the 2017 cohort to the 2018 cohort by 3 percent. The launch of the CSOB mentoring program is expected to increase these graduation rates in the future.
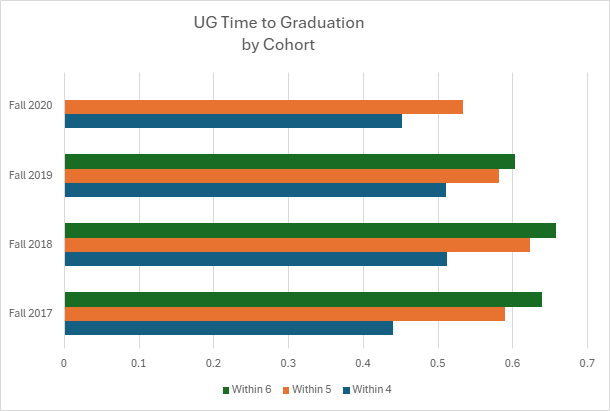
| Cohort | Within 4 | Within 5 | Within 6 |
|---|---|---|---|
| Fall 2017 | 44.00% | 59.00% | 64.00% |
| Fall 2018 | 51.28% | 62.39% | 65.81% |
| Fall 2019 | 51.06% | 58.16% | 60.28% |
| Fall 2020 | 45.21% | 53.42% | n/a |
The undergraduate graduation data demonstrates that a large portion of students successfully complete their degrees with some taking longer than four years, as shown by the Fall 2018 cohort improving from a four-year rate of 51.28% to the period's highest six-year rate of 65.81%. The most recent Fall 2020 cohort presents a concerning lower five-year completion rate of 53.42%, which potentially reflects pandemic-related disruptions. A significant number of graduate students are working full-time and are personally paying for their educational expenses which can impact the time it takes them to graduate.
Graduation Rate for Carter School of Business Graduate Students
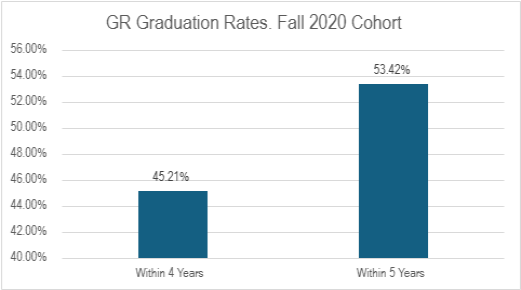
| Cohort | Within 4 | Within 5 |
|---|---|---|
| Fall 2018 | 60.19% | 62.96% |
| Fall 2019 | 60.18%% | n/a |
| Fall 2020 | 45.21% | 53.42% |
Student Satisfaction Results
Every semester the Carter School of Business administers surveys to our students. Part of the information gleaned from the answers provides a snapshot of the satisfaction of our students with the CSOB program. The following information is used for Quality Assurance and Continuous Improvement of the program. All answers are tabulated on a 5-point scale with 1 being poor and 5 being excellent. An average rating of 4.5 or better was achieved in all three areas listed below from Fall 2021 through Fall 2023. The results of the survey are tabulated below for course presentation, assessment, and servant leadership exhibited by our faculty:
- Fall 2022: 4.51
- Spring 2023: 4.51
- Fall 2023: 4.52
- Spring 2024: 4.54
- Fall 2024: 4.47
- Spring 2025: 4.47
- Total: 4.50
- Fall 2022: 4.47
- Spring 2023: 4.51
- Fall 2023: 4.58
- Spring 2024: 4.53
- Fall 2024: 4.43
- Spring 2025: 4.45
- Total: 4.5
- Fall 2022: 4.56
- Spring 2023: 4.56
- Fall 2023: 4.58
- Spring 2024: 4.59
- Fall 2024: 4.51
- Spring 2025: 4.52
- Total: 4.55
Based on the survey results, faculty evaluations within the CSB consistently place performance between Good (4) and Excellent (5) by maintaining an overall rating of approximately 4.5 across five semesters for all three criteria. This indicates that students are highly satisfied with the course presentation, assessment methods, and the servant leadership exhibited by professors. Notably, the critical Faith Integration category has maintained a strong and consistent rating of 4.5 in every term, showing our faculty commitment to the mission. The questions on the survey are aligned with the University’s overall mission, which emphasizes the integration of faith and learning to produce servant leaders.
Faculty Evaluation Survey Results
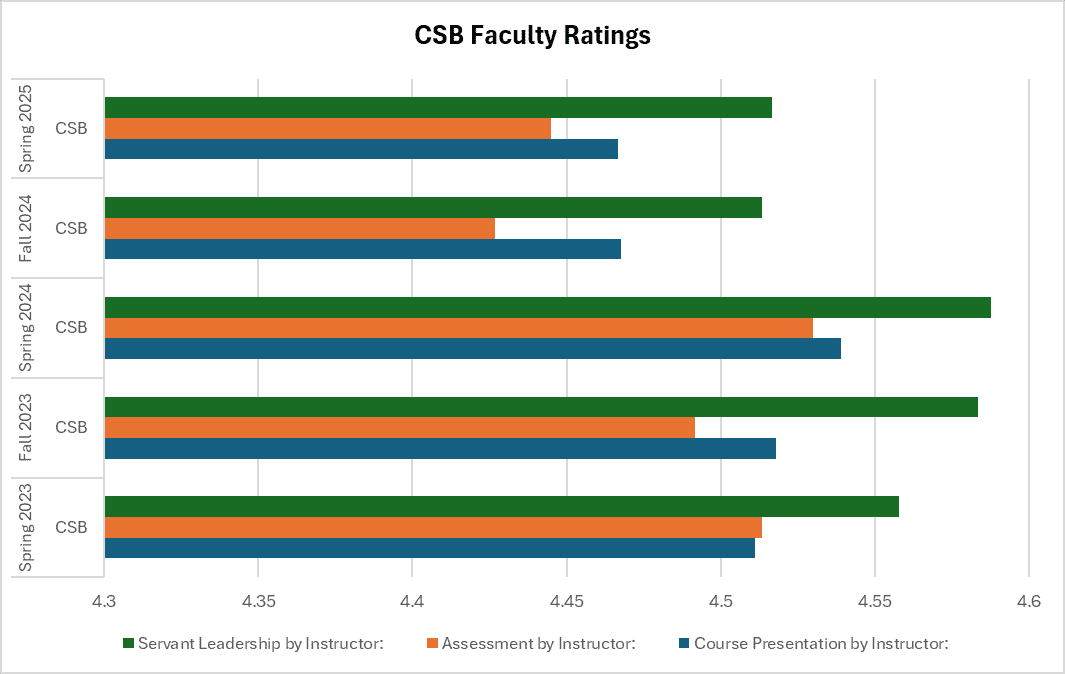
Based on the survey results, student satisfaction levels remained high from 2021 to 2023. The areas highlighted focus on how well faculty presented the course information, the quality and fairness of assessments in the course, and how well the faculty served the students. The questions on the survey are aligned with the University’s overall mission, which emphasizes the integration of faith and learning to produce servant leaders.


